Chapter 3 Revising MELD from calendar-time cross-sections with correction for selection bias
An article based on this chapter has appeared in BMC Medical Research Methodology, de Ferrante, H.C., De Rosner-van Rosmalen M., Smeulders, B.M.L., Vogelaar, S., Spieksma, F.C.R., 2024, 10.1186/s12874-024-02176-8, [55]
Abstract
Eurotransplant allocates livers using the MELD score as originally proposed by UNOS. Several studies have revised this UNOS-MELD score using retrospective data on liver transplant candidates. The standard approach taken in such studies is to model 90-day waiting list mortality from the time of listing, based on biomarkers reported at listing, while censoring candidates at delisting or transplantation. This approach ignores a candidate’s biomarkers that were reported after registration, and ignores informative censoring by transplantation and delisting.
We study how MELD revision is affected by using calendar-time cross-sections and by correcting for informative censoring with inverse probability censoring weighting (IPCW). To this end, we revised UNOS-MELD on patients with cirrhosis who were on the Eurotransplant waiting list between 2007 and 2019 (n=13,274) with Cox models with as endpoints 90-day survival (a) from registration and (b) from weekly drawn calendar-time cross-sections. We refer to the score revised from cross-section with IPCW as DynReMELD. We compare DynReMELD to UNOS-MELD and ReMELD, a prior revision of UNOS-MELD for Eurotransplant, in a geographical validation.
Our results show that revising MELD from calendar-time cross-sections leads to significantly different MELD coefficients. IPCW increases estimates of absolute 90-day waiting list mortality risks by approximately 10 percentage points. DynReMELD shows improved discrimination compared to UNOS-MELD (delta c-index: 0.0040, p<0.001) and ReMELD (delta c-index: 0.0015, p<0.01), with differences comparable in magnitude to the addition of an extra biomarker to MELD (delta c-index: ±0.0030).
Correction for selection bias by transplantation or delisting with inverse probability censoring weighting does not improve the discrimination of revised MELD scores, but does substantially increase estimates of absolute 90-day mortality risks. Revision from cross-section uses waiting list data more efficiently, and improves discrimination compared to revision of MELD exclusively based on the information available at listing.
3.1 Introduction
Eurotransplant calculates MELD scores with a formula originally introduced by UNOS in 2002. We refer to this score as UNOS-MELD. Various limitations of UNOS-MELD have been described, including that
it was not developed to predict mortality on the liver waiting list [33],
it overemphasizes renal dysfunction [40],
it uses biomarker caps that are not evidence-based [41],
it is poorly calibrated for specific subgroups, such as patients with hyponatremia [37].
These limitations have motivated several studies to revise MELD, either by re-estimating the equation’s coefficients using registry data on liver transplant candidates (e.g., [40], [41]), or by expanding the scoring system with new biomarkers (e.g., MELD-Na [37] or MELD 3.0 [20]). In 2020, the equation’s coefficients and caps of MELD were revised by Goudsmit et al. using retrospective data from Eurotransplant. The resulting score is referred to as the “ReMELD” score [42].
MELD revision typically proceeds by modeling waiting list mortality up to 90 days after waiting list registration based on biomarkers reported at registration (e.g., [20], [37], [41], [42]). This “from registration” approach poorly aligns with the clinical use of MELD: in allocation, candidates are prioritized on their last reported MELD score, and not on the MELD score that was reported at listing. Moreover, revising MELD “from registration” ignores waiting list deaths that occur more than 90 days after listing, which are two-thirds of all liver waiting list deaths within Eurotransplant.
Previously, such waste of statistical information was avoided by adjusting for MELD biomarkers as time-varying covariates ([39], [40]). However, MELD biomarkers also increase as part of the death process [56], such that use of MELD biomarkers as time-varying covariates leads to issues of reverse causality. This reverse causality problem is exacerbated by the fact that MELD scores can be updated voluntarily at any time and by the fact that sicker patients are required to update their MELD scores more frequently.
To prevent these issues, we propose revising MELD “from cross-section” using methodology developed by Gong and Schaubel [57]. With this approach MELD is revised by modeling the remaining time-until-death from pre-specified calendar-time cross-sections rather than from registration. Biomarkers measured after listing and deaths recorded more than 90 days after listing thereby inform MELD revision. To prevent issues of reverse causality, adjustment at each cross-section is for historical biomarker information only. The evolution of biomarkers after the cross-section date affects survival, transplantation and delisting rates, which makes transplantation and delisting informative censoring mechanisms. Prior revisions of MELD censor patients at transplantation or delisting, which introduces bias. We study how MELD revision is affected by correcting for dependent censoring with inverse probability censoring weighting, which was first proposed by Gong and Schaubel [57].
3.2 Materials and methods
3.2.1 Study population and data
Adult patients with any active waiting list status on the Eurotransplant waiting list between December 16, 2006, and December 31, 2019, were extracted from the Eurotransplant database. Only patients with cirrhosis were included in the study, which is the patient group on which UNOS-MELD was originally validated. Patients with other diagnoses, those prioritized through exception points, and those awaiting a repeat transplantation or combined transplantation were excluded (except combined liver-kidney transplantation candidates). Patients with impossible values for MELD biomarkers (e.g., all zeroes for bilirubin, creatinine, and the INR) were excluded.
To activate a candidate on the liver waiting list, centers have to report MELD biomarkers to Eurotransplant. Reported MELD scores are valid for a maximum of one year, and expire in a shorter time window for sicker patients (within seven days for MELD scores greater than 25 [58]). Failure to update the MELD score results in the lowest possible MELD score of 6 being used for allocation. Consequently, MELD updates are available for most transplant candidates in the Eurotransplant database. Centers can set candidates to non-transplantable (NT) if they are temporarily not available for transplantation, which ensures that the transplant center is not contacted with offers for these patients.
3.2.2 MELD scores, UNOS-MELD and ReMELD
We define a MELD scoring system as a system that calculates a score based on serum bilirubin, serum creatinine and the INR, using the following formula:
\[\text{intercept}\ + \text{coef}_{\text{bili}}\ln\left( \text{bili} \right) + \ \text{coef}_{\text{crea}}\ln\left( \text{crea} \right) + \text{coef}_{\text{INR}}\ln\left( \text{INR} \right),\]
with serum bilirubin and serum creatinine measured in mg/dl. A specific MELD score proposes values for the intercept and coefficients, and bounds for the values of MELD biomarkers. A MELD score also has to propose how to calculate MELD scores for candidates who received dialysis twice in the week before measurement of MELD biomarkers (henceforth “patients on biweekly dialysis”), since dialysis reduces measured creatinine levels. Eurotransplant currently uses UNOS-MELD for allocation, i.e.
\[6.43\ + 3.78\ln\left( \text{bilirubin} \right) + 9.57\ln\left( \text{creatinine} \right) + 11.20\ln\left( \text{INR} \right),\]
in which creatinine is capped at 4.0 mg/dl, a lower limit of 1.0 is imposed on all biomarkers, and creatinine is set to 4.0 mg/dl for patients on biweekly dialysis.
Various revisions of MELD have been proposed (e.g., see [41], [42], [56]). One alternative – that was developed specifically for Eurotransplant – is ReMELD [42], which calculates the score as
\[8.422\ + 7.728\ln\left( \text{bili} \right) + \ 3.446\ \ln\left( \text{crea} \right) + 10.597\ln\left( \text{INR} \right).\]
In calculating ReMELD scores, bilirubin is bounded between 0.3 and 27 mg/dl, the INR is bounded between 0.1 and 2.6, and creatinine is bounded between 0.7 and 2.5 mg/dl. Creatinine is also set to the upper cap of 2.5 mg/dl for patients on biweekly dialysis.
3.2.3 Revision “from registration” vs. “revision from cross-section”
In revising MELD, authors typically re-estimate MELD coefficients “from registration”. By this, we mean that authors use Cox proportional hazards models to model 90-day waiting list mortality after registration with adjustment for MELD biomarkers that were reported at listing. Coefficients for the MELD scoring system are then commonly derived by rescaling the estimated regression coefficients (\(\widehat{\beta}\)) to the UNOS-MELD scale. This rescaling is typically achieved by matching quantiles of the linear predictor to corresponding quantiles of UNOS-MELD scores (e.g., [41], [42]). This “from registration” approach ignores any MELD measurements recorded after registration, as well as patient deaths recorded more than 90 days after registration. We propose to avoid such waste of statistical information by revising MELD with a “from cross-section” approach. The key differences between these approaches are illustrated in Figure 3.1.
The “from cross-section” approach uses methodology developed by Gong and Schaubel [57], and models the remaining time-until-death from pre-specified calendar-time cross-sections (see right panel, Figure 3.1). This approach uses cross-section calendar times as the time origin, and the time elapsed since the cross-section date as the timescale. The coefficients are estimated with a Cox proportional hazards model that is stratified by the cross-section. At each cross-section only patients with an active registration (i.e., without non-transplantable status) are included in the analysis, and Cox models adjust only for biomarker information reported before the cross-section. We point out that patients waiting at multiple calendar-time cross-sections contribute multiple observations to the Cox model fit (right panel, Figure 3.1). Thereby, revision of MELD is also affected by (i) waiting list deaths that occur more than 90 days after listing, and (ii) biomarker measurements taken after listing.
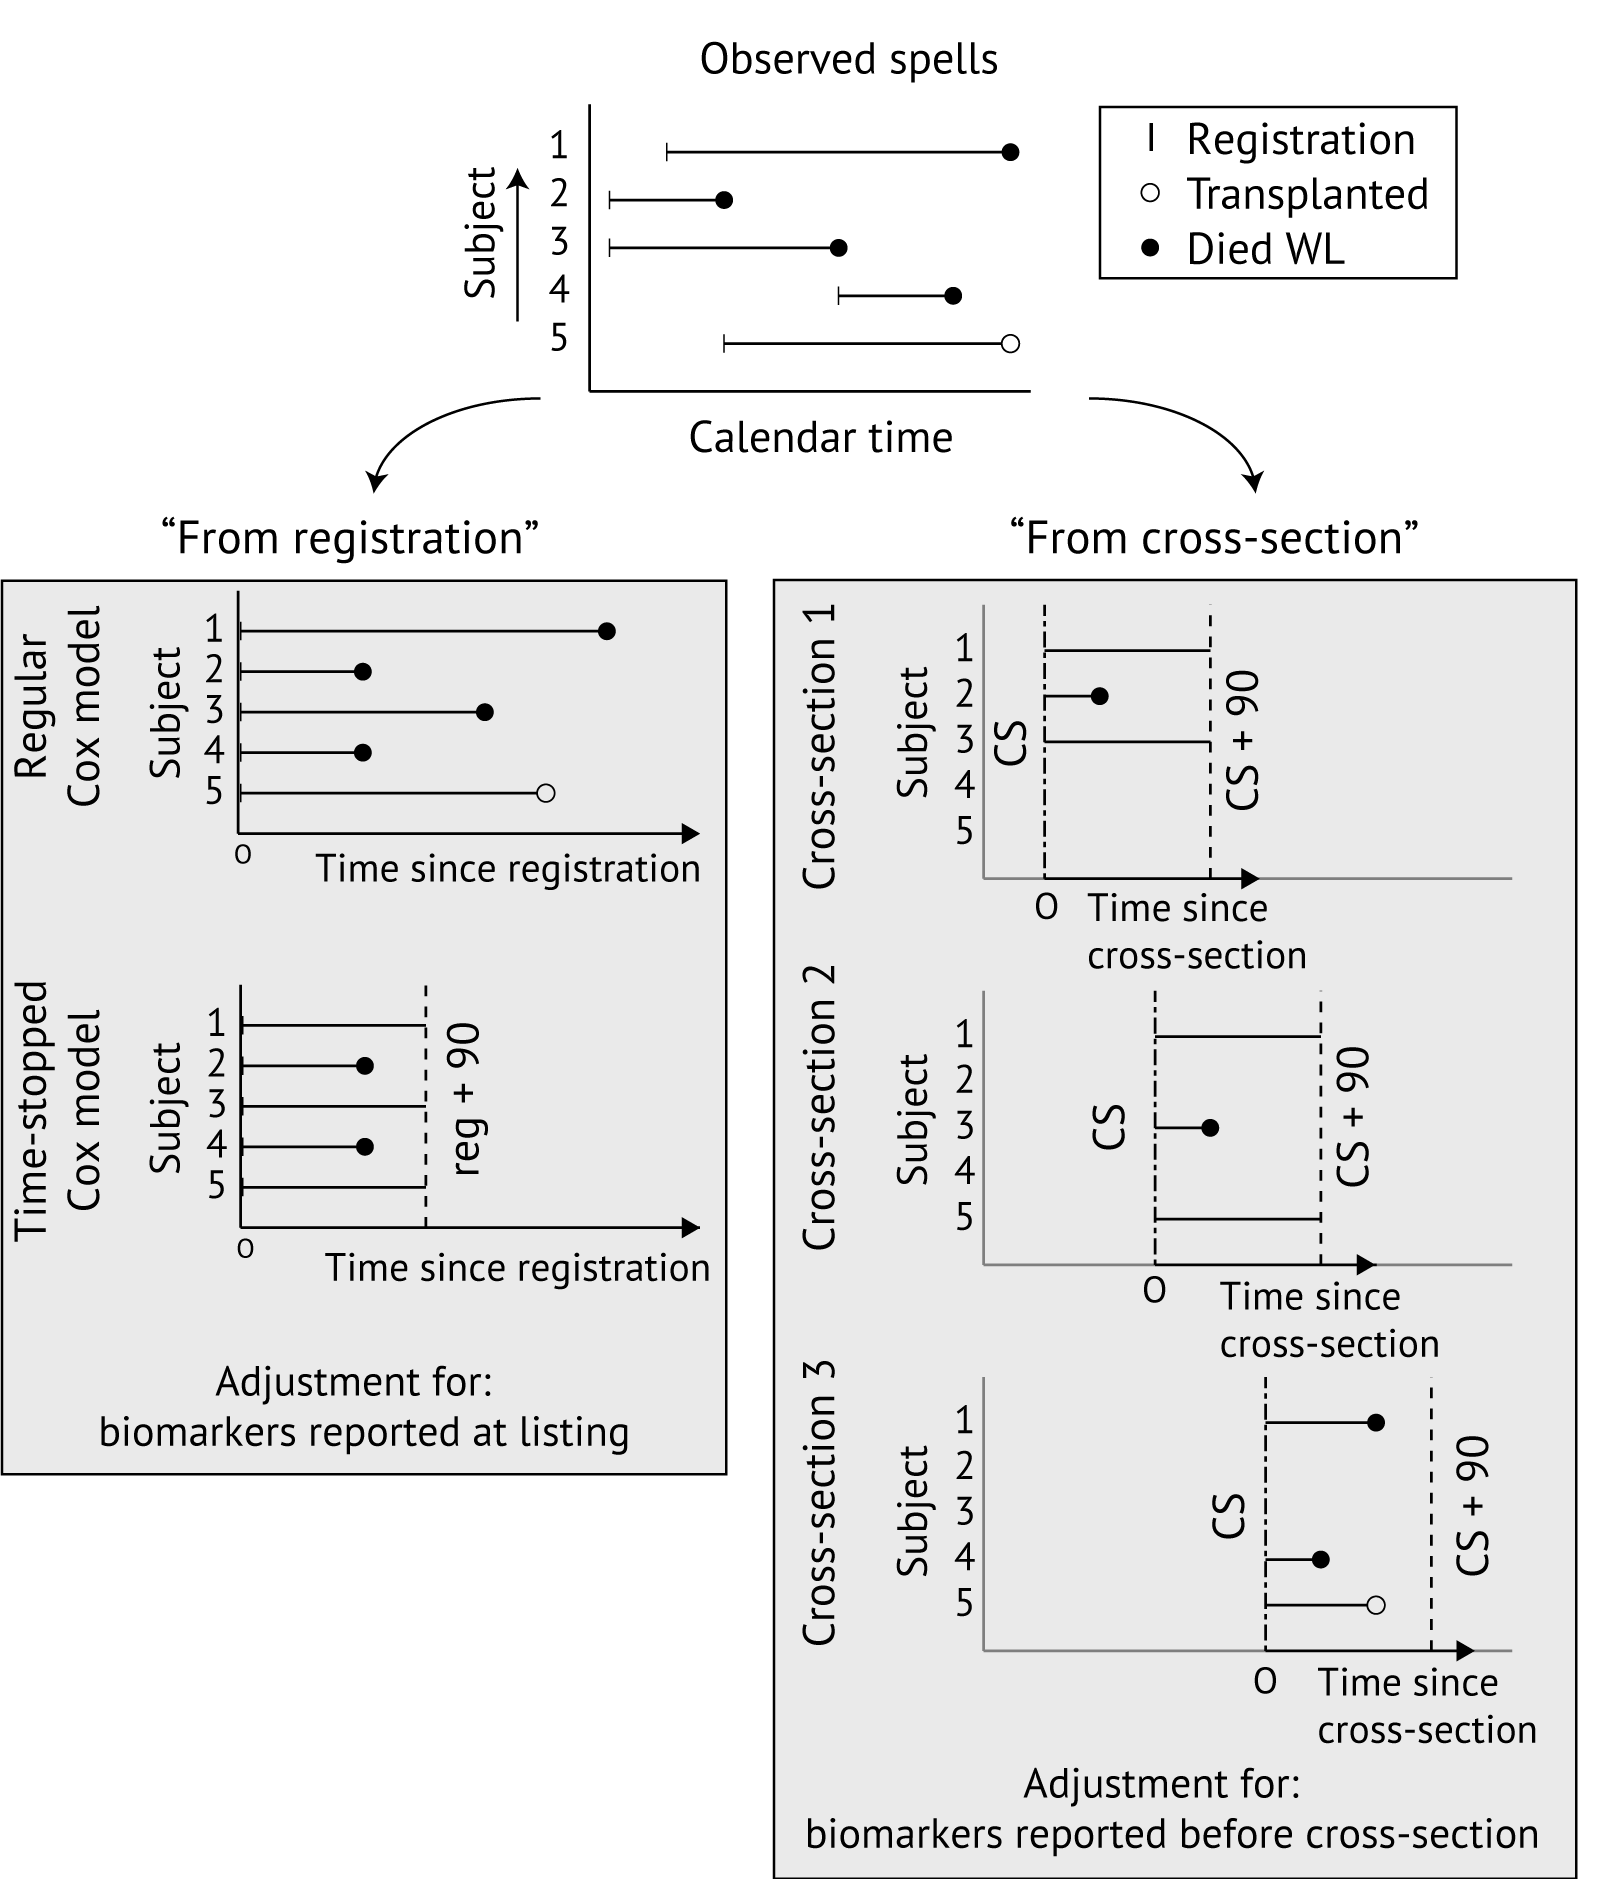
Figure 3.1: Illustration of from “registration” and “from cross-section” approaches to modeling waiting list mortality. For revision of MELD, typically 90-day time-stopped Cox models are used. The “from registration” approach (left) uses time since registration as the timescale and adjusts for biomarkers reported at registration. The “from cross-section” approach (right) models time-until-death from cross-section dates, pre-specified in calendar time, and adjusts for MELD biomarkers reported before the cross-section date. WL, waiting list.
In this chapter, we compare revision of MELD “from registration” to revision “from cross-section”. In revising MELD “from registration”, we stratify models by country of listing. For the “from cross-section” approach, we use weekly cross-sections from December 22, 2006 to December 31, 2019 and stratify Cox models by the candidate’s country of listing and by cross-section. The candidate survival status 90 days after the cross-section date is used as an endpoint, and adjustment at each cross-section is for the last reported MELD biomarker values before the cross-section date.
3.2.4 Outcome definition
Time-until-death is modeled with 90-day time-stopped Cox PH models. Delisted patients who die within 90 days of deregistration are treated as if they had died on waiting list exit (as in [42]). Patients who were transplanted or delisted within 90 days are censored. Inverse probability censoring weighting (IPCW) is used to correct for selection bias due to transplantation and delisting.
3.2.5 Inverse probability censoring weighting to correct for dependent censoring
Consistent estimation of parameters \(\beta\) with a standard Cox PH model requires that the censoring process is independent of survival, conditional on covariates. This independent censoring assumption is violated for both the “from registration” and “from cross-section” approaches, because only MELD biomarkers reported at listing (or before the cross-section date) are included as covariates, while MELD biomarkers reported after listing (or cross-section) affect patient survival and transplantation/delisting rates. Gong and Schaubel proposed a procedure that can correct for the bias introduced by dependent censoring due to transplantation. This procedure weighs candidates by their inverse probability of having been transplanted between the cross-section and exit date (IPCW-T weights, T for transplantation). Such probabilities can be estimated using an extended Cox proportional hazards model, which uses the candidate’s transplantation status as the outcome.
We expand in this chapter on Gong and Schaubel’s approach by also constructing inverse probability censoring weights for delisting (IPCW delisting (IPCW-D) weights). Under the assumption that delisting and transplantation are conditionally independent, a joint inverse probability censoring weight can then be obtained by multiplying IPCW-T and IPCW-D weights (see also [59]). Details on how weights were constructed are included in Appendix A. In this chapter, we assess how IPCW affects revised MELD coefficients both “from registration” and “from cross-section”.
3.2.6 Adjustment variables, caps, and functional forms
Cox PH models adjust for variables present in MELD, i.e., serum bilirubin, serum creatinine, and the INR. Spline terms are used to assess whether the relation between log-transformed biomarkers and the mortality rate is approximately linear. Final models use logarithmic transformations for the biomarkers, with lower and upper limits for biomarkers optimized over regions where violation of log-linearity was visually apparent (as in Leise et al. [41] and Goudsmit et al. [42]).
On the Eurotransplant liver waiting list, more than 10% of patients receive biweekly dialysis, and measured creatinine is not used to calculate lab-MELD scores for these patients. To also ignore measured creatinine in revising MELD for these patients, we set creatinine to 1.0 mg/dl for patients on dialysis (leading to \(\ln(1.0) = 0\) MELD points). Instead, we use whether the patient receives biweekly dialysis as an adjustment variable.
3.2.7 Development and validation cohorts
To enable revision and geographical validation for all Eurotransplant countries, we aimed to use a 70%/30% center-based split per country. Such a split was feasible for Germany (70%/30%), Belgium (70.1%/29.9%) Austria (62.6%/37.4%), and the Netherlands (74.3%/25.7%), but not for Hungary (1 center), Slovenia (1 center), and Croatia (1 large center, 2 very small centers). Therefore, Hungarian, Slovenian and Croatian patients (11% of the total cohort) were randomly split into 70%/30% development/validation cohorts.
All models – including those used to estimate inverse probability weights – were fitted on the development cohort only. The validation cohort was used to compare the newly developed score – which we name DynReMELD – to ReMELD and UNOS-MELD.
3.2.8 Comparison to UNOS-MELD and ReMELD
We revised MELD “from registration” and “from cross-section” both with and without IPCW. Without IPCW, MELD was also revised with ReMELD’s linear predictor used as an offset. This enables assessment of whether revision of MELD on all cirrhotic patients yields a significantly different equation from ReMELD. We define DynReMELD as the equation obtained by quantile matching the linear predictor revised “from cross-section” with IPCW to quantiles of UNOS-MELD. We compare the discrimination of MELD, ReMELD and DynReMELD using the c-index in the validation cohort. This c-index quantifies the degree to which patients with a higher score die earlier on the Eurotransplant waiting list. In the literature, the c-index is most commonly estimated with Harrell’s c-index, which is a consistent estimator of the c-index in case of independent censoring. Because this assumption is implausible in liver transplantation, we use Gerd’s c-index [60]. This c-index is a consistent estimator for the c-index provided that a consistent estimator of the conditional probability of remaining uncensored is available [60], [61]. We estimate Gerd’s c-indices for two separate prediction tasks, namely (i) prediction of time-until-death from listing based on biomarkers reported at listing, and (ii) prediction of remaining time-until-death from calendar-time cross-sections based on the last reported MELD biomarkers.
Assessment of calibration for DynReMELD is complicated by the fact that models developed with IPCW are counterfactual prediction models, and it is not clear how to assess calibration for such models [62]. Instead of assessing calibration, we report estimates of absolute 90-day survival risks for DynReMELD estimated with and without IPCW. These 90-day survival estimates are of interest to Eurotransplant, as Eurotransplant uses them to convert awarded exception scores to the MELD scale.
3.3 Results
This study included 13,343 liver waiting list registrations for 13,274 patients1 with cirrhosis waiting for a first liver transplant. We note that candidates with exception points (for example, HCC) were not included in our study cohort. We excluded 107 patients (<1%) because they reported impossible MELD biomarker values (e.g., zeroes for all biomarkers). Baseline characteristics of development and validation cohorts are included in Table 3.1.
| variable | level | development (n=9,288) | validation (n=4,055) | p-value |
|---|---|---|---|---|
|
UNOS-MELD at listing |
mean (Q1-Q3) | 21.0 (13.0-28.0) | 20.3 (12.0-28.0) | <0.001 |
|
bilirubin (mg/dl) at listing |
mean (Q1-Q3) | 7.53 (1.63-8.54) | 7.06 (1.43-8.00) | 0.009 |
|
creatinine (mg/dl) at listing |
mean (Q1-Q3) | 1.54 (0.810-1.75) | 1.46 (0.803-1.60) | 0.001 |
| INR | mean (Q1-Q3) | 1.79 (1.29-2.00) | 1.75 (1.21-1.91) | 0.024 |
| biweekly dialysis | yes | 1096 (11.8%) | 504 (12.4%) | 0.318 |
| no | 8192 (88.2%) | 3551 (87.6%) | ||
| patient sex | male | 6226 (67.0%) | 2761 (68.1%) | 0.239 |
| female | 3062 (33.0%) | 1294 (31.9%) | ||
|
age at listing |
mean (Q1-Q3) | 53.8 (49.0-61.0) | 54.4 (49.0-61.0) | <0.001 |
| cirrhosis aetiology | alcoholic | 4949 (53.3%) | 2292 (56.5%) | <0.001 |
| autoimmune/cryptogenic | 1596 (17.2%) | 619 (15.3%) | ||
| hepatitic | 1712 (18.4%) | 528 (13.0%) | ||
| metabolic/other | 669 (7.2%) | 484 (11.9%) | ||
| NAFLD | 362 (3.9%) | 132 (3.3%) | ||
| outcome by Dec 31, 2019 | waiting list death | 2265 (24.4%) | 980 (24.2%) | <0.001 |
| transplanted | 5068 (54.6%) | 2105 (51.9%) | ||
| removed (other) | 700 (7.5%) | 278 (6.9%) | ||
| recovered | 610 (6.6%) | 327 (8.1%) | ||
| waiting | 645 (6.9%) | 365 (9.0%) | ||
| NAFLD; non-alcoholic fatty liver disease. |
3.3.1 Number of MELD scores informing the revision of MELD
With cross-sections, 8,779 out of 9,288 (95%) patients in the development cohort are active at a cross-section date, and inform revision of MELD. The remaining 509 patients were transplanted, delisted, or marked non-transplantable before a cross-section date was reached (which means they exited the waiting list within at most 7 days of listing). We note that these 509 candidates do not inform revision of MELD from cross-section.
Table 3.2 shows that the number of unique MELD scores informing MELD revision increases about sevenfold with a “from cross-section” approach, from 9,264 to 67,433. The number of observed waiting list deaths and event rates also increase substantially with the “from cross-section” approach. For example, “from cross-section” the number of included MELD scores between 36 and 40 triples from 456 to 1,248, with 47% of these patients dying 90 days after cross-section, compared to only 31% “from registration”.
| group | dataset | # usable MELD scores | death or removed unfit | transplanted |
|---|---|---|---|---|
| from registration | 9264 | 846 (9.1%) | 2598 (28.0%) | |
| from cross-section | 67433 | 5906 (8.8%) | 11071 (16.4%) | |
| by MELD | ||||
| 6-14 | from registration | 3291 | 67 (2.0%) | 389 (11.8%) |
| from cross-section | 28192 | 454 (1.6%) | 1565 (5.6%) | |
| 15-24 | from registration | 4355 | 382 (8.8%) | 1199 (27.5%) |
| from cross-section | 30806 | 2938 (9.5%) | 5766 (18.7%) | |
| 25-35 | from registration | 1160 | 253 (21.8%) | 711 (61.3%) |
| from cross-section | 7187 | 1922 (26.7%) | 3144 (43.7%) | |
| 36-40 | from registration | 458 | 144 (31.4%) | 299 (65.3%) |
| from cross-section | 1248 | 592 (47.4%) | 596 (47.8%) | |
3.3.2 Revising the MELD formula using Cox models
Evidence-based caps were derived using the procedure proposed by Leise et al. [41]. This procedure involves estimating Cox proportional hazard models with different caps applied and choosing the caps that result in the maximal log-likelihood. The procedure is applied separately for each biomarker, with the biomarker under consideration modeled linearly and the other biomarkers modeled non-linearly using spline terms. Figure 3.2 summarizes the results of this procedure. The optimal caps were found to be 0.6–55 mg/dl for bilirubin, 0.8–2.5 mg/dl for serum creatinine, and 1.0–3.0 for the INR.
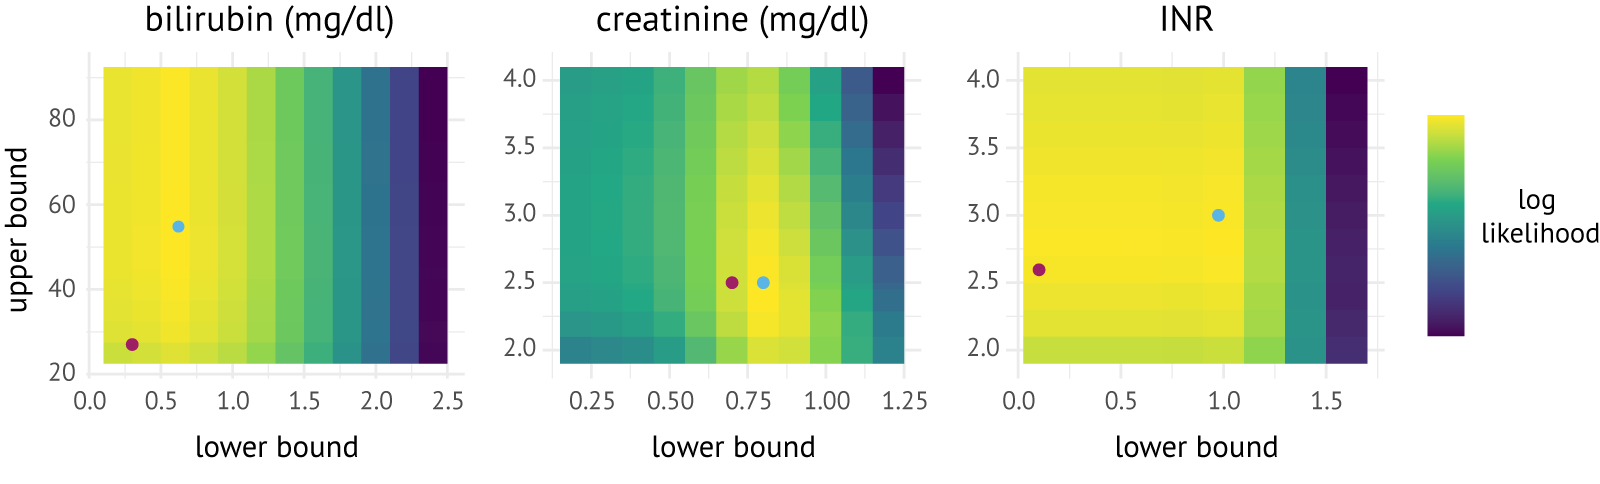
Figure 3.2: Heatmaps of the log-likelihood values for combinations of lower and upper bounds for serum bilirubin (mg/dl), serum creatinine (mg/dl), and the INR. Blue dots represent the optimal caps in the development data; purple dots represent the caps derived for ReMELD.
3.3.2.1 Coefficients revised from registration
Panel A of Table 3.3 shows MELD coefficients revised “from registration”. The first column shows that parameter estimates are jointly not significantly different from 0 (\(\chi_{3}^{2}\) = 4.1,p = 0.25) when using ReMELD’s prognostic index as an offset. The insignificance of these estimates confirms that ReMELD adequately predicts 90-day mortality “from registration” for all cirrhotic patients. IPCW changes the biomarker coefficients only slightly (by less than a standard error).
3.3.2.2 Coefficients revised from cross-section
Panel B of Table 3.3 shows MELD coefficients revised “from cross-section”. The first column shows that coefficients are jointly significantly different from 0 with ReMELD used as an offset (\(\chi_{3}^{2}\) = 801,p < 0.001). Hence, ReMELD does not adequately predict 90-day mortality from cross-section. Estimated coefficients suggest ReMELD underestimates the effect of creatinine (\(z\)= 5.2, p < 0.001) and bilirubin (\(z\) = 6.1, p < 0.001), but not the INR (\(z = 0.3,p = 0.76\)). IPCW appears to increase MELD biomarker coefficients slightly (by less than a standard deviation).
Table 3.4 shows the relative weights put on the MELD components by the equation revised from cross-section with IPCW. These weights, originally defined by Sharma et al. [40], quantify the increase in MELD score resulting from a one-standard deviation increase in a given biomarker, relative to a one-standard deviation increase in all biomarkers. These weights also show that the refitted equation puts more weight on bilirubin (41%) than UNOS-MELD (36%) and ReMELD (37%), and puts less weight on the INR (28% vs. 32% for UNOS-MELD and 34% for ReMELD).
|
|
|
|
|---|---|---|---|
| ln(bilirubin (mg/dL)) | 0.03 (0.05) | 0.69 (0.05) | 0.73 (0.06) |
| ln(creatinine\(^1\) (mg/dL)) | 0.10 (0.09) | 1.62 (0.01) | 1.61 (0.12) |
| ln(INR) | 0.12 (0.17) | 2.02 (0.17) | 2.19 (0.21) |
| biweekly dialysis | 1.85 (0.12) | 1.73 (0.13) | |
| LR Test | 4.1 (df = 3) | 1482 (df = 4) | 1883 (df = 4) |
|
|
|
|
|---|---|---|---|
| ln(bilirubin (mg/dl)) | 0.22 (0.04) | 0.92 (0.04) | 0.97 (0.04) |
| ln(creatinine\(^1\) (mg/dl)) | 0.40 (0.08) | 2.07 (0.08) | 2.15 (0.08) |
| ln(INR) | 0.04 (0.13) | 2.06 (0.13) | 2.22 (0.15) |
| biweekly dialysis | 1.87 (0.12) | 1.86 (0.12) | |
| LR Test | 801 (df = 3) | 22 197 (df = 4) | 26 933 (df = 4) |
| 1 set to 1.0 mg/dl in case of biweekly dialysis |
| biomarker | standard deviation | UNOS-MELD | ReMELD | DynReMELD |
|---|---|---|---|---|
| bilirubin (mg/dl) | 0.85 | 0.36 | 0.37 | 0.41 |
| creatinine (mg/dl) | 0.29 | 0.32 | 0.29 | 0.31 |
| INR | 0.26 | 0.32 | 0.34 | 0.28 |
3.3.3 Definition of the DynReMELD score
Quantile matching of UNOS-MELD to the linear predictor revised “from cross-section” with IPCW (Table 3.3, panel B) yielded the following equation for DynReMELD: \[ 4.14 \ln(\text{bilirubin}) + 9.12 \ln(\text{creatinine}) + 9.42 \ln(\text{INR}) + 8.50 \] with creatinine bounded between 0.8 and 2.5 mg/dl, bilirubin between 0.6 and 55 mg/dl, and the INR between 1.0 and 3.0. We calculate DynReMELD scores by setting creatinine to the upper cap (2.5 mg/dl) for patients on dialysis. This choice was made to keep DynReMELD in line with existing clinical implementations of MELD, and is relatively harmless because the creatinine level required to attain the same priority as biweekly dialysis is \(\exp\left( \frac{1.86}{2.15} \right)\ \approx 2.4\ \)mg/dl (Table 3.3, Panel B, third column).
3.3.4 Predictive performance
Table 3.5 shows estimates of Gerd’s c-index for UNOS-MELD, ReMELD and DynReMELD, for (a) predicting 90-day waiting list survival from listing based on biomarkers reported at listing, and (b) predicting 90-day waiting list survival from calendar-time cross-sections based on the biomarkers that were last reported for the candidate. The first panel shows c-indices evaluated for predicting 90-day waiting list survival from listing based on biomarkers reported at listing for UNOS-MELD, ReMELD and DynReMELD. Point estimates appear to slightly favor DynReMELD, but bootstrapped pairwise differences are not statistically significant. The second panel shows that DynReMELD outperforms UNOS-MELD and ReMELD when predicting 90-day waiting list survival based on candidates’ last reported biomarkers, with DynReMELD attaining higher c-indices (p < 0.001) in both development and validation cohorts. In the validation cohort, the c-index of DynReMELD (0.7895) is approximately 0.0040 higher than UNOS-MELD (0.7855), and 0.0015 higher than ReMELD (0.7879).
| score | development | validation |
|---|---|---|
| time-until-death from listing, based on biomarkers at listing | ||
| UNOS-MELD | 0.8494 (0.008) | 0.8637 (0.011) |
| ReMELD | 0.8503 (0.008) | 0.8623 (0.011) |
| DynReMELD | 0.8523† (0.008) | 0.8641 (0.011) |
| remaining time-until-death from cross-sections, based on last reported biomarkers | ||
| UNOS-MELD | 0.8099 (0.002) | 0.7855 (0.004) |
| ReMELD | 0.8203*** (0.002) | 0.7879 (0.004) |
| DynReMELD | 0.8217***††† (0.002) | 0.7895***†† (0.004) |
| † p < 0.05, †† p < 0.01, ††† p < 0.001, compared to ReMELD | ||
| ∗ p < 0.05, ∗∗ p < 0.01, ∗∗∗ p < 0.001, compared to UNOS-MELD | ||
3.3.5 Estimated absolute survival risk per MELD Score
This section reports absolute 90-day mortality risks for UNOS-MELD and DynReMELD estimated “from cross-section”. The estimation of mortality risks “from cross-section” is complicated by the fact that most individuals contribute multiple, correlated observations to the Cox model. In principle, this dependence can be broken by reporting cross-section-specific estimates of 90-day waiting list survival, but such estimates are imprecise. To partially break the dependence, we chose to estimate 90-day survival on a data set that included, for each reported set of biomarkers, only the first cross-section where the patient had an active waiting list status. Table 3.6 shows 90-day mortality risks estimated in this way.
The table shows that inverse probability censoring weighting increases estimates of absolute 90-day mortality risks by almost 10 percentage points. Failing to correct for informative censoring therefore results in mortality equivalents that understate the counterfactual mortality risk. This is of interest to Eurotransplant, as these mortality equivalents are used by Eurotransplant to assign exception points.
Candidates with multiple sets of biomarkers still contribute multiple observations to estimating 90-day mortality risks from cross-section. Dependence between such observations can bias estimates of the 90-day mortality risks. It is reassuring that point estimates of 90-day mortality risks from registration (see Table 3.7) are close to estimates from cross-section (generally less than 5 percentage point differences are observed).
| score | no IPCW | IPCW | no IPCW | IPCW |
|---|---|---|---|---|
| 20 | 0.103 [0.098-0.108] | 0.122 [0.117-0.127] | 0.097 [0.092-0.101] | 0.113 [0.108-0.118] |
| 22 | 0.149 [0.142-0.155] | 0.179 [0.171-0.186] | 0.145 [0.139-0.151] | 0.173 [0.166-0.180] |
| 24 | 0.212 [0.202-0.221] | 0.258 [0.247-0.270] | 0.214 [0.205-0.224] | 0.260 [0.249-0.271] |
| 25 | 0.251 [0.239-0.263] | 0.308 [0.294-0.322] | 0.259 [0.247-0.271] | 0.315 [0.301-0.329] |
| 26 | 0.297 [0.282-0.311] | 0.365 [0.348-0.382] | 0.310 [0.295-0.325] | 0.379 [0.361-0.396] |
| 28 | 0.407 [0.385-0.428] | 0.498 [0.473-0.522] | 0.435 [0.413-0.457] | 0.529 [0.503-0.553] |
| 29 | 0.470 [0.444-0.495] | 0.572 [0.544-0.599] | 0.508 [0.482-0.533] | 0.612 [0.583-0.639] |
| 30 | 0.538 [0.508-0.566] | 0.649 [0.617-0.678] | 0.585 [0.555-0.613] | 0.696 [0.664-0.725] |
| 31 | 0.609 [0.576-0.640] | 0.725 [0.691-0.755] | 0.664 [0.632-0.694] | 0.777 [0.744-0.805] |
| 32 | 0.681 [0.645-0.714] | 0.796 [0.762-0.825] | 0.742 [0.708-0.772] | 0.848 [0.817-0.874] |
| 33 | 0.751 [0.714-0.784] | 0.859 [0.827-0.885] | 0.814 [0.780-0.842] | 0.907 [0.880-0.927] |
| 34 | 0.816 [0.780-0.846] | 0.910 [0.883-0.931] | 0.875 [0.845-0.900] | 0.949 [0.929-0.964] |
| 35 | 0.872 [0.839-0.899] | 0.949 [0.927-0.964] | 0.925 [0.899-0.943] | 0.977 [0.963-0.985] |
| 36 | 0.918 [0.890-0.940] | 0.974 [0.960-0.984] | 0.959 [0.941-0.972] | 0.991 [0.984-0.995] |
| 37 | 0.953 [0.930-0.968] | 0.989 [0.980-0.994] | 0.981 [0.969-0.989] | 0.997 [0.994-0.999] |
| 39 | 0.989 [0.979-0.994] | 0.999 [0.997-1.000] | 0.998 [0.995-0.999] | 1.000 [1.000-1.000] |
| 40 | 0.996 [0.991-0.998] | 1.000 [0.999-1.000] | 0.999 [0.998-1.000] | 1.000 [1.000-1.000] |
| score | from cross-section | from registration | from cross-section | from registration |
|---|---|---|---|---|
| 20 | 0.103 [0.098-0.108] | 0.136 [0.127-0.144] | 0.097 [0.092-0.101] | 0.125 [0.116-0.132] |
| 22 | 0.149 [0.142-0.155] | 0.187 [0.176-0.197] | 0.145 [0.139-0.151] | 0.176 [0.166-0.186] |
| 24 | 0.212 [0.202-0.221] | 0.254 [0.240-0.267] | 0.214 [0.205-0.224] | 0.247 [0.233-0.260] |
| 26 | 0.297 [0.282-0.311] | 0.339 [0.321-0.356] | 0.310 [0.295-0.325] | 0.339 [0.321-0.356] |
| 28 | 0.407 [0.385-0.428] | 0.443 [0.420-0.466] | 0.435 [0.413-0.457] | 0.453 [0.429-0.476] |
| 30 | 0.538 [0.508-0.566] | 0.564 [0.535-0.591] | 0.585 [0.555-0.613] | 0.586 [0.556-0.613] |
| 32 | 0.681 [0.645-0.714] | 0.691 [0.657-0.721] | 0.742 [0.708-0.772] | 0.724 [0.690-0.753] |
| 34 | 0.816 [0.780-0.846] | 0.810 [0.776-0.839] | 0.875 [0.845-0.900] | 0.847 [0.815-0.873] |
| 36 | 0.918 [0.890-0.940] | 0.905 [0.877-0.927] | 0.959 [0.941-0.972] | 0.935 [0.912-0.953] |
| 40 | 0.996 [0.991-0.998] | 0.991 [0.983-0.995] | 0.999 [0.998-1.000] | 0.997 [0.993-0.999] |
3.4 Discussion
Prior literature revised the MELD score with liver waiting list candidate data “from registration” (e.g., [20], [37], [42]), which ignores any MELD biomarker measurements that are reported after registration and any waiting list death that occurs more than 90 days after registration. We used methodology proposed by Gong and Schaubel [57] to model waiting list mortality from calendar-time cross-sections, which can avoid such waste of statistical information in revising MELD. Moreover, we assessed how revision of MELD was affected by correction for selection bias by transplantation or delisting with inverse probability censoring weighting.
We showed that the “from cross-section” approach uses waiting list registry data substantially more efficiently, with the number of waiting list deaths and MELD scores informing revision of MELD increasing sevenfold compared to revision “from registration”. DynReMELD, the score obtained by quantile matching UNOS-MELD to the risk equation that was developed “from cross-section” with IPCW, attains significantly higher c-indices than ReMELD and UNOS-MELD in a geographical validation cohort for predicting remaining time-until-death based on last reported MELD biomarkers (p < 0.001). This is important for Eurotransplant, as Eurotransplant liver allocation prioritizes candidates based on their last reported MELD scores and not MELD at listing. In magnitude, the improvements in c-indices (0.0015 compared to ReMELD, and 0.0040 compared to UNOS-MELD) are comparable to the addition of serum sodium to ReMELD (approx. delta c-index of 0.0030) [42] and the addition of serum albumin to MELD 3.0 (delta c-index of 0.0028) [20]. MELD revision from cross-section with IPCW can thus improve urgency-based risk stratification. Our results suggest that the improvement is due to modeling time-remaining-until-death from cross-sections and not IPCW, as IPCW changed estimated coefficients only slightly.
We believe the main reason why DynReMELD outperforms ReMELD in geographical validation is that revision “from cross-section” uses Eurotransplant registry data substantially more efficiently than revision “from registration”, as the latter method only uses the MELD biomarkers that were reported at listing and the first 90 days of waiting list survival. This raises the question whether revision “from registration” cannot also be improved upon by using available registry data more efficiently. One way of doing this would be to include MELD biomarkers as time-varying covariates. However, because MELD biomarkers also increase inherently as part of the death process, use of biomarkers as time-varying covariates leads to issues of reverse causality. Follow-up data could, in principle, also be used more efficiently by not restricting revision “from registration” to the first 90 days after listing. However, we found that this leads to violations of the proportional hazards assumption for MELD biomarkers. We also assessed how estimates of the 90-day mortality risks are affected by (a) revision “from cross-section” and (b) correcting for dependent censoring with IPCW. Revision “from cross-section” does not meaningfully change estimated 90-day mortality risks, with risks estimated “from cross-section” differing by less than 5 percent points from risks estimated “from registration”. This means that we do not find that there are meaningful differences in 90-day mortality risks between a candidate who reported a particular MELD score at listing and another one who reported that same score as part of a MELD recertification. Mitigation of selection bias with IPCW did increase estimated 90-day waiting list mortality risks for both UNOS-MELD and DynReMELD by 10 percentage points. Failure to account for informative censoring by transplantation/delisting thus leads to an underestimation of 90-day mortality equivalents, which can be problematic as Eurotransplant uses these estimates to assign MELD scores for candidates who receive exception points.
Eurotransplant currently consists of 38 liver transplant centers located in seven European countries. These centers differ structurally in terms of patient populations, liver transplantation volumes, and willingness to accept donors of marginal quality. A strength of our study is that we assigned candidates to either the development or validation cohort based on their center of listing, which means that the predictive performance of DynReMELD was evaluated in a cohort independent from the centers on which the score was developed.
A limitation of our work is that revision of MELD “from cross-section” only uses the last MELD biomarkers reported before the cross-section date. Eurotransplant uses these same biomarker measurements for allocation, but they may be outdated representations of a patient’s health status. Alternatively, one could model the evolution of MELD biomarkers over time with linear mixed models, and use a best linear unbiased predictions (BLUP) of biomarkers at every cross-section time. This BLUP approach was first proposed by Maziarz et al. [63] for landmarking, a statistical technique which bears similarities to Gong and Schaubel’s approach. We did not use a BLUP approach to revise MELD, since irregular spacing of MELD measurements complicates modeling the biomarker process. Deployment of BLUP models would also be practically challenging for Eurotransplant. Moreover, MELD scores for patients with significant 90-day mortality risks are rarely outdated as Eurotransplant requires frequent re-certification of MELD scores for sicker patients. For example, MELD scores are on average 12 days old at cross-section for candidates with MELD scores ranging between 20 and 25 (corresponding to a 90-day mortality risk of 10 to 25%), and 3 days old for MELD scores greater than 25 (which corresponds to a mortality risk of 25% or greater). A final limitation of our work is that DynReMELD was based only on bilirubin, creatinine and the INR, while updated versions of MELD exist that use additional biomarkers. Future work could focus on revising these UNOS-MELD alternatives “from cross-section”. This was not pursued in this chapter, because serum sodium and albumin are unavailable in Eurotransplant registry data for most patients on the liver waiting list.
References
A small group of patients is removed from the waiting list without transplant, but later re-registered.↩︎