Chapter 7 Access to transplantation for immunized candidates
An article based on this chapter has appeared in Transplantation, de Ferrante, H.C., Smeulders, B.M.L., Tieken, I., Heidt, S., Haasnoot, G., Claas, F.H.J., Vogelaar, S., Spieksma, F.C.R., 2023. 10.1016/j.ajt.2024.06.018 [152]
Abstract
The presence of donor-specific antibodies (DSAs) before transplantation is associated with graft rejection and poor transplantation outcomes. Kidney transplant centers can assign HLA antigens as unacceptable, to prevent kidney offers against which their candidates have developed clinically relevant antibodies. In this chapter, we assess to what degree having unacceptable antigens affects access to transplantation in ETKAS.
For this, candidates for kidney-only transplantation listed between January 1, 2016, and January 1, 2020 were included (n=19,240). Cox regression was used to quantify the relation between the relative transplant rate and the vPRA. Models used accrued dialysis time as the timescale, were stratified by patient country and blood group, and adjusted for non-transplantable status, patient age, sex, history of kidney transplantation, and the prevalence of 0 HLA-DR mismatched donors in Eurotransplant’s donor pool.
Transplant rates were 23% lower for vPRA >0–50%, 51% lower for vPRA 75–85%, and decreased rapidly for vPRA >85% (p < 0.001). The inverse relation between transplant rate and vPRA is independent of Eurotransplant country, listing time, and the availability of donors with 0 HLA-DR mismatches. Results were similar when quantifying the relation between vPRA and the attainment of a sufficiently high rank for ETKAS offer, which suggests that the lower transplant rates for immunized patients are due to ETKAS allocation, and not the offer acceptance behavior of kidney transplant centers. We conclude that the current ETKAS allocation mechanism inadequately compensates immunized patients for reduced access to transplantation.
7.1 Introduction
The presence of pre-formed HLA antibodies restricts a candidate’s potential donor pool, which could imply that immunized candidates face prolonged waiting times. In Eurotransplant, highly immunized candidates (vPRA >85%) may access the AM program, in which more than half of the patients are transplanted within a year of entry [153]. However, fewer than 10% of the immunized candidates meet the AM entry criteria, and the remaining 90% of immunized candidates depend on ETKAS for access to transplantation.
In ETKAS, immunized candidates are indirectly prioritized via the mismatch probability, which is the probability that among the next 1,000 reported donors, there is no blood group-identical donor, who has no HLA antigens unacceptable to the candidate and who has at most 1 HLA mismatch with the candidate. However, it has been questioned whether enough points are given to the mismatch probability to avoid prolonged waiting times for immunized candidates [133]. An additional problem is that an increased vPRA may only marginally increase the mismatch probability for some patient groups, such as candidates with a difficult-to-match HLA typing or those with blood group AB [134]. These criticisms suggest that the priority currently awarded to immunized patients in ETKAS is insufficient.
In Eurotransplant, two prior studies have examined the relation between the relative transplant rate and immunization, both using cohorts from Germany. These studies used the vPRA to quantify immunization status. Firstly, a six-center study by Ziemann et al. studied the impact of vPRA on time-to-transplantation with a 2012 cohort, using Cox proportional hazard (PH) models with time elapsed since 2012 as the timescale [134]. Adjusting for blood group, accrued dialysis time, and the vPRA, Ziemann et al. reported that a 1% increase in vPRA is associated with an approximate 1% decrease in transplant rate. A limitation of the Ziemann et al. study is that the 2012 cohort precedes the actual implementation of the vPRA in Eurotransplant, such that those vPRA values may not be a reliable proxy for a candidate’s degree of immunization.
Zecher et al. [135] studied the relation between vPRA and the transplant rate with a 2019 German population-wide cohort. Instead of the time a candidate had spent on the waiting list, Zecher et al. used time-on-dialysis as the timescale. Adjusting for recipient age, sex, blood group, percentage time being transplantable, allocation region, and enrolment in the AM program, Zecher et al. described that only highly immunized patients (vPRA >85%) have significantly lower transplant rates in Germany (42% lower). Whether this finding is generalizable to other Eurotransplant member countries is an open question, because dialysis time is a bottleneck in Germany but not in Eurotransplant’s other member countries. In this chapter, we examine the relation between the vPRA and the relative transplant rate, using a 2016 to 2020 cohort of all kidney-only transplant candidates on the ETKAS waiting list. Unlike the aforementioned studies, we were able to use vPRA as a time-varying variable, and can adjust for a candidate’s non-transplantable status.
7.2 Materials and methods
7.2.1 Study population and data
Kidney-only transplant candidates on the ETKAS waiting list between January 1, 2016, and January 1, 2020 were included. The start date of January 1, 2016 was chosen because the median vPRA reported for immunized candidates stabilized in 2016. The end date was chosen because Covid-19 substantially reduced transplant activity in 2020 [154]. Candidates waiting for a living donor transplantation and transplant candidates with additional priority in allocation were excluded. The latter group included patients who require a combined transplantation, pediatric patients, and patients with a High Urgency (HU) status. Our analyses use accrued dialysis time as the timescale. This means that the transplantation rate could not be modeled for preemptively listed patients, i.e. patients who did not start dialysis before being activated on the Eurotransplant kidney waiting list. Patients listed preemptively thus entered our analysis only on the date they started dialysis, and patients that were transplanted preemptively were excluded. transplant candidates were censored at age 65 because candidates above this age become eligible for allocation through the Eurotransplant Senior Program (ESP). We also censored candidates at entry into the AM program.
7.2.2 Outcome variables
Time-to-transplantation was used as the primary outcome. Patients waiting for a transplant on January 1, 2020 were censored, as were patients that were delisted for other reasons than transplantation (waiting list death or removal). An unmeasured confounder of the relation between vPRA and the transplant rate may be local (center) policies with respect to accepting kidney offers. For example, risk averse centers or doctors may use a liberal definition of unacceptability (increasing the vPRA) and have strict requirements for donor-recipient match quality (turning down more kidney offers). This risk-averseness could thereby increase the candidate’s vPRA and prolong their waiting time, which could induce an association between the vPRA and the transplant rate that is not due to ETKAS allocation itself. This motivated us to also assess the relation between vPRA and the kidney offer rate. Pivotal for this is careful definition of what constitutes an offer. The relation between vPRA and time to actual offer can also be confounded by kidney offer acceptance policies, as allocation profiles can be used to specify that a candidate wishes to be excluded from potential kidney offers (for example, based on donor age, extended criteria donors, and HLA match quality). To avoid confounding bias in a time-to-offer analysis, we define time-to-offer as the first time a patient was ranked high enough on a kidney match list to have received an actual offer (ignoring offer turndowns due to allocation profiles). This information is retrievable from unfiltered match lists from the Eurotransplant database. We refer to this outcome as “time-to-any-offer”.
This time-to-any-offer may be of limited clinical relevance. For instance, it could be that the offered kidney had a poor HLA match quality with the candidate, or that the kidney was first declined by many other candidates for quality reasons. We therefore also assess the relation between vPRA and a “high-quality” offer, where “high quality” is defined as an offer with no HLA-DR mismatches that was declined for quality reasons by fewer than five higher-ranked candidates.
7.2.3 Adjustment variables, transformations, and stratification
Multivariable Cox proportional hazards (PH) models were used to study the relation between the vPRA and the transplant rate. The vPRAs used were calculated against ETRL donor panel (v3.0), which includes HLA data on the serological split level for HLA-A, -B, -C, -DR and -DQ. We note that centers and local HLA laboratories may have differing policies in labeling antigens as unacceptable [134]. For over half of immunized patients the set of unacceptable antigens changed while on the ETKAS waiting list. This motivated use of vPRA as a time-varying variable.
Cox models used time-on-dialysis as the timescale, since ETKAS allocation is driven by accrued dialysis time and not waiting time. A potential issue with using time-on-dialysis as the time scale is that patients may have started with dialysis before they were listed for kidney transplantation in ETKAS. Such previously accrued dialysis time could bias the analysis, as a standard Cox model would consider patients with previously accrued dialysis time to have been at risk of transplantation before they were actually listed on the kidney waiting list of Eurotransplant. To avoid such bias, we estimate the relation between vPRA and waiting list outcomes using the extended Cox model, which allows for delayed entry. One prior study did not use a non-linear transformation for vPRA [134], which implicitly makes the assumption that an increase from vPRA 0% to 1% has the same effect as an increase from 99% to 100%. This assumption is implausible, because a candidate with a vPRA of 1% can still access 99% of donors, while a candidate with vPRA 100% cannot receive any offers. Another study allowed for a non-linear effect of vPRA by discretizing the vPRA (0%, 0.1–50%, 50.1–85%, 85.1–95%, and >95%). One disadvantage to discretizing the vPRA is that it assumes that candidates in the same group (e.g., vPRA 0.1% and 50%) all have the same reduction in relative transplant rate. A second disadvantage is that it wastes statistical information [155]. We therefore use in our preferred specification a spline transformation for the vPRA (with 8 degrees of freedom). We compare this strategy to using a fine-grained discretization of the vPRA (0%, >0–25%, 25–50%, 50–75%, 75–85%, 85–95%, 95–99%, 99–100%).
Confounders adjusted for in the analysis are the patient age at listing, patient sex, and the number of previously received kidney transplants (none, 1 or 2+). For each patient, we also counted the number of 0 HLA-DR mismatched kidneys among the last 10,000 donors reported to Eurotransplant (ignoring blood group identity), and adjusted for this number in our analyses. We adjusted for the HLA-DR locus because this locus most strongly affects outcomes after kidney transplantation. We did not adjust for the mismatch probability because the mismatch probability is indirectly based on the vPRA, which leads to issues of multicollinearity. Finally, we adjusted for whether the patient was non-transplantable (time-varying variable). All these confounders have to be reported to Eurotransplant to activate a candidate on the kidney waiting list, such that there was no missing data. We adjusted for penalized spline terms of continuous confounders with 4 degrees of freedom (candidate age and the number of 0 HLA-DR mismatched kidneys).
How much dialysis time a candidate needs in order to receive an offer through ETKAS strongly depends on their country of listing and blood group. Such heterogeneity makes a proportional hazards assumption for blood group and recipient country implausible and motivated us to stratify Cox proportional hazards models by recipient country and blood group. Within Germany, we stratified based on the seven organ procurement regions because donor availability differs by region.
7.3 Results
This study included 19,420 patients on the ETKAS waiting list between January 1, 2016, and January 1, 2020 (see Table 7.1). In total, 1,316 patients were excluded because they were transplanted preemptively. Unacceptable antigens were reported for 21% of the candidates that met inclusion criteria, either at registration or before study start (January 1, 2016). For almost 21% of patients this first set of unacceptable antigens reported was updated after their registration, or after study start. In total, unacceptable antigens were reported for almost 30% of patients during the study period. Immunization (defined as vPRA >0%) was associated with being female, having had a previous transplantation, having accrued more time on dialysis, and having spent more time on the waiting list (p < 0.001, see Table 7.1). Figure 7.2 plots per Eurotransplant center the distribution in vPRA for immunized patients. Although there is center-to-center variation in reported vPRAs, most variation in vPRA is at the patient level.
| level | 0% | 0.1-49.9% | 50-84.9% | 85-100% | |
|---|---|---|---|---|---|
| (n=15319) | (n=1442) | (n=1534) | (n=1110) | (n=19405) | |
| patient sex | |||||
| female | 5,097 (33.3%) | 741 (51.5%) | 828 (53.9%) | 600 (53.1%) | 7,266 (37.4%) |
| male | 10,219 (66.7%) | 699 (48.5%) | 707 (46.1%) | 529 (46.9%) | 12,154 (62.6%) |
| age at registration | |||||
|
median [Q1-Q3] |
50 [41-57] | 49 [40-56] | 48 [40-55] | 47 [39-54] | 50 [41-56] |
| patient blood group | |||||
| O | 6558 (42.8%) | 651 (45.1%) | 624 (40.7%) | 438 (39.5%) | 8271 (42.6%) |
| A | 5856 (38.2%) | 528 (36.6%) | 602 (39.2%) | 445 (40.1%) | 7431 (38.3%) |
| B | 2215 (14.5%) | 208 (14.4%) | 228 (14.9%) | 160 (14.4%) | 2811 (14.5%) |
| AB | 690 (4.5%) | 55 (3.8%) | 80 (5.2%) | 67 (6.0%) | 892 (4.6%) |
| accrued dialysis time at registration or by January 1, 2016 (years) | |||||
|
median [Q1-Q3] |
2.0 [0.82-4.5] | 3.0 [1.2-5.6] | 3.1 [1.3-5.8] | 3.7 [1.8-6.6] | 2.2 [0.91-4.8] |
| previous kidney transplantations | |||||
| 0 | 14,366 (93.8%) | 925 (64.1%) | 658 (42.9%) | 361 (32.5%) | 16310 (84.1%) |
| 1 | 895 (5.8%) | 462 (32.0%) | 714 (46.5%) | 567 (51.1%) | 2638 (13.6%) |
| 2+ | 58 (0.4%) | 55 (3.8%) | 162 (10.6%) | 182 (16.4%) | 457 (2.4%) |
| final vPRA (before waitlist exit, or AM/ESP entry) | |||||
| 0% | 13,522 (88.3%) | 68 (4.7%) | 26 (1.7%) | 5 (0.5%) | 13621 (70.2%) |
| 0.01-49.9% | 868 (5.7%) | 1049 (72.7%) | 40 (2.6%) | 2 (0.2%) | 1959 (10.1%) |
| 50-84.9% | 565 (3.7%) | 199 (13.8%) | 1068 (69.6%) | 63 (5.7%) | 1895 (9.8%) |
| 85-100% | 364 (2.4%) | 126 (8.7%) | 400 (26.1%) | 1040 (93.7%) | 1930 (9.9%) |
| changed vPRA during the study period (between January 1, 2016 and December 31, 2019) | |||||
| yes | 1797 (11.7%) | 611 (42.4%) | 841 (54.8%) | 775 (69.8%) | 4024 (20.7%) |
| no | 13522 (88.3%) | 831 (57.6%) | 693 (45.2%) | 335 (30.2%) | 15381 (79.3%) |
| status on January 1, 2020 | |||||
| ETKAS transplant | 5,982 (39.1%) | 535 (37.2%) | 547 (35.6%) | 242 (21.4%) | 7,306 (37.6%) |
| death or delisted unfit | 719 (4.7%) | 79 (5.5%) | 97 (6.3%) | 68 (6.0%) | 963 (5.0%) |
| delisted other | 155 (1.0%) | 12 (0.8%) | 16 (1.0%) | 11 (1.0%) | 194 (1.0%) |
| AM entry | 89 (0.6%) | 39 (2.7%) | 118 (7.7%) | 265 (23.5%) | 511 (2.6%) |
| ESP entry | 1,009 (6.6%) | 108 (7.5%) | 102 (6.6%) | 63 (5.6%) | 1,282 (6.6%) |
| waiting | 7,362 (48.1%) | 667 (46.3%) | 655 (42.7%) | 480 (42.5%) | 9,164 (47.2%) |
| time transplantable (years, between January 1, 2016 and December 31, 2019) | |||||
|
median [Q1-Q3] |
1.1 [0.42-2.2] | 1.4 [0.51-2.7] | 1.3 [0.51-2.6] | 1.3 [0.47-2.6] | 1.1 [0.42-2.3] |
| proportion time transplantable (between January 1, 2016 and December 31, 2019) | |||||
|
median [Q1-Q3] |
91% [59%-100%] | 95% [65%-100%] | 95% [67%-100%] | 96% [66%-100%] | 92% [60%-100%] |
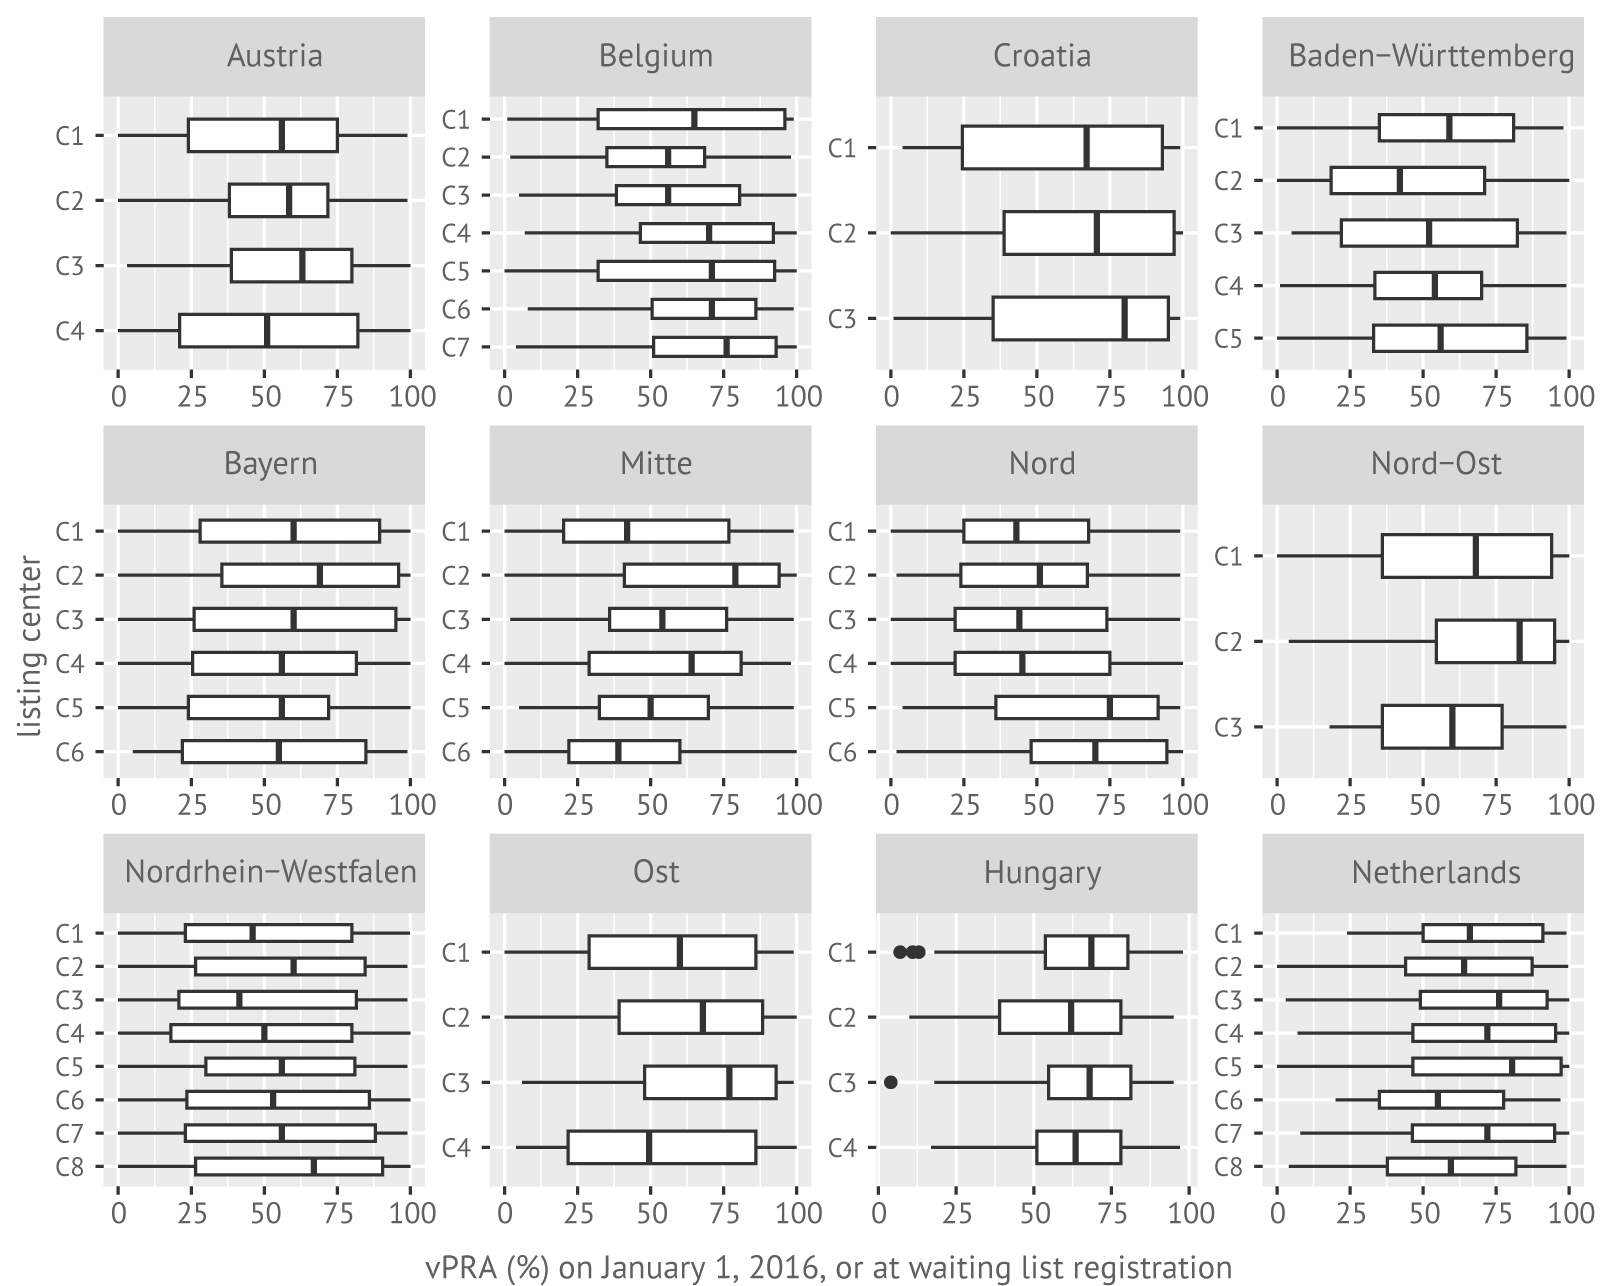
Figure 7.1: Distributions of the vPRA (%) per center for immunized patients who were active on the kidney transplant waiting list between January 1, 2016, and January 1, 2020.
7.3.1 The association of the vPRA with ETKAS transplant rates
The curve in Figure 7.2 shows the estimated relation between the relative transplant rate and the vPRA. The relative transplant rate decreases with a higher vPRA. Adjusting for vPRA categories rather than with a spline term yields similar results (horizontal dotted lines, Figure 7.2). The relative transplant rate for patients with vPRA 0.1-50% is estimated to be 23% lower than non-immunized patients, and 51% lower for patients with vPRA 75–85%. For vPRAs exceeding 85%, the relative transplant rate decreases rapidly: it is 65% lower for candidates with vPRA ranging between 85% and 95% than for non-immunized candidates, and 94% lower for candidates with vPRAs ranging between 99 and 100%.
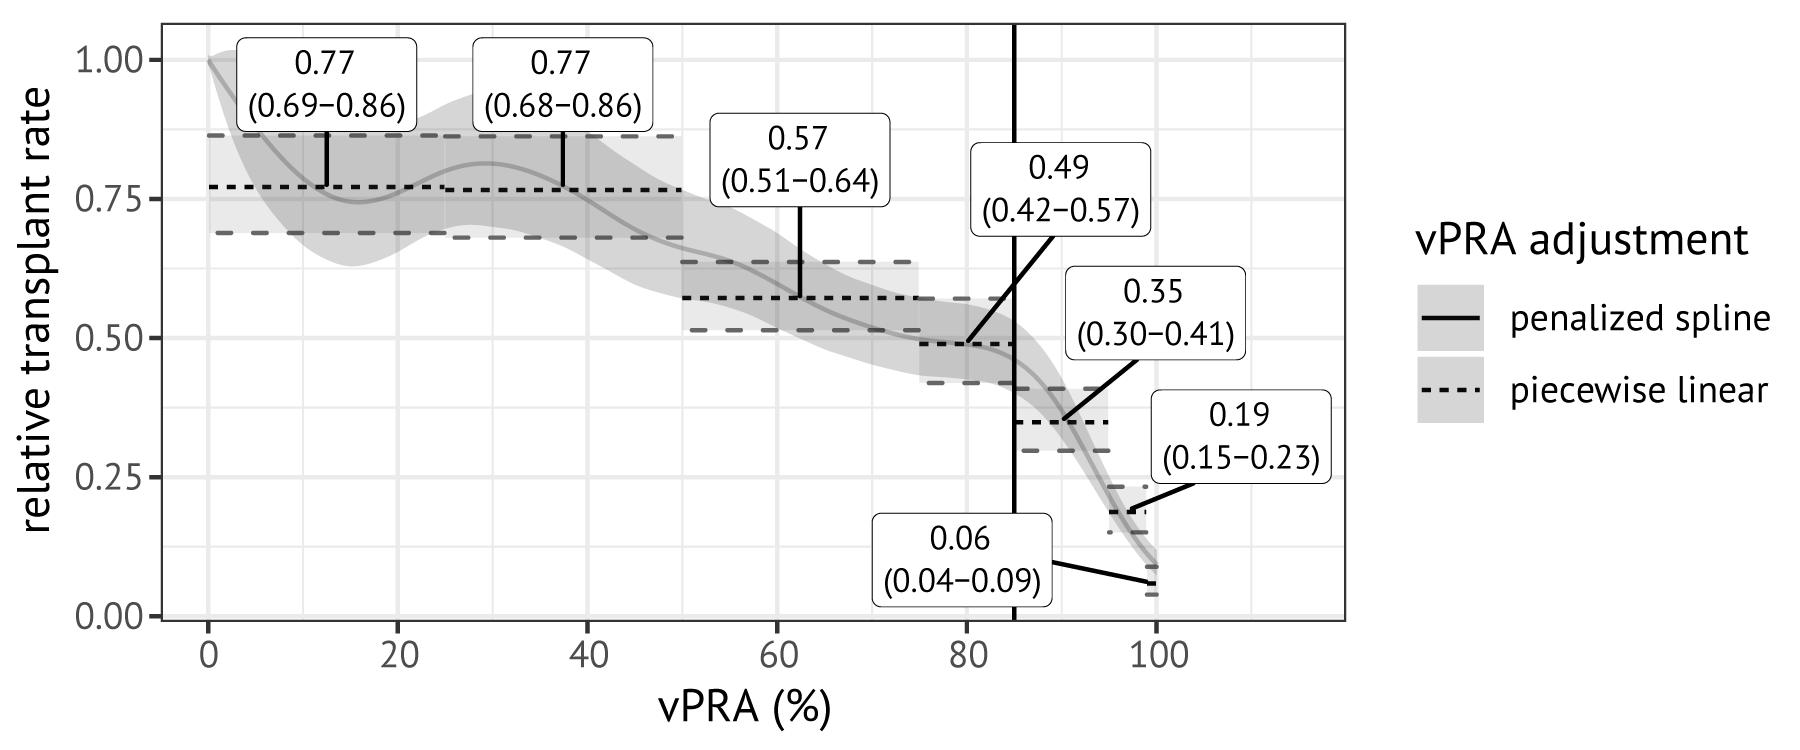
Figure 7.2: Relation between the relative ETKAS transplant rate and vPRA. This relation was estimated with a Cox proportional hazards model using vPRA as a time-varying variable and adjustment for other variables. The solid grey line was estimated using penalized spline terms with 8 degrees of freedom; the dotted lines were obtained by adjusting for discretized vPRA. Labels indicate point estimates of the hazard ratios for vPRA categories with 95% confidence intervals.
7.3.2 Predicted transplant probabilities for a synthetic patient across Eurotransplant regions and blood groups
Figure 7.3 shows predicted transplant probabilities for a hypothetical patient based on a Cox proportional hazards model fitted with delayed entry. This hypothetical patient was defined as a patient who is a 49-year-old, male primary transplant candidate, who had accrued 2 years of dialysis time at listing and who remained transplantable and non-immunized (vPRA 0%) during their waiting list registration. The predicted probability of transplantation is almost 100% within the first 4 years of registration in all Eurotransplant countries except for Germany where the predicted probability of transplantation is just over 25% (except for blood group AB). Comparing transplant probabilities across blood groups shows that blood group AB patients have the highest transplant rates in Austria, Hungary, and Germany, but not in the Netherlands and Belgium. This suggests that a proportional hazards assumption is implausible for blood group and highlights the need for stratifying Cox models by both blood group and recipient location.
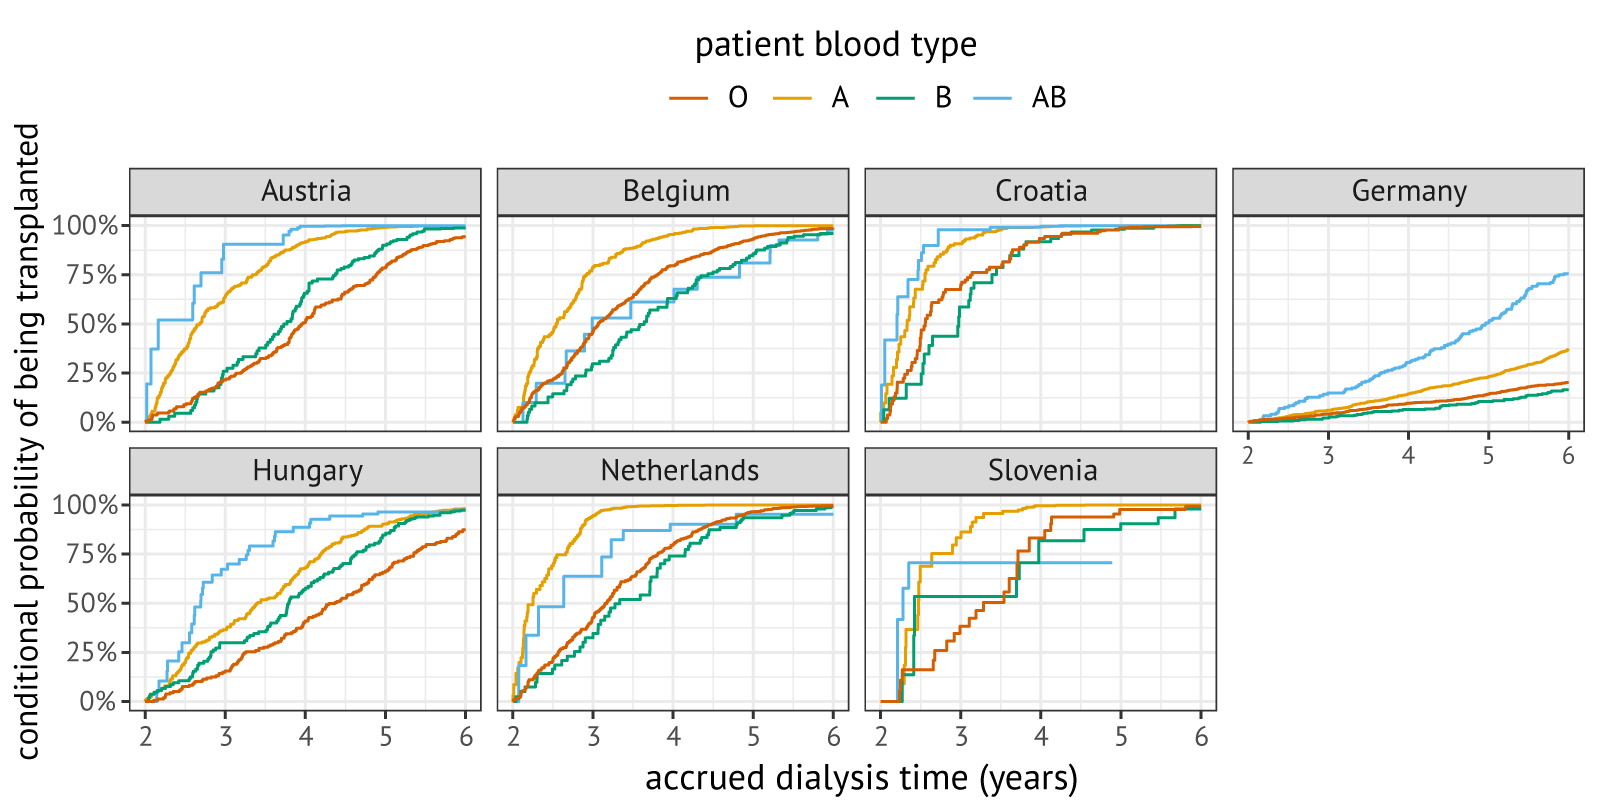
Figure 7.3: Predicted conditional probabilities of being transplanted within four years upon entering the waiting list with two years of dialysis time, stratified by blood group and listing country. Predictions were made for a 49-year-old, male candidate who was listed for their first kidney transplantation. For Germany, distributions are displayed per DSO region.
7.3.3 Sensitivity checks for the main result
Our main result is that a candidate’s relative transplant rate decreases substantially with an increasing vPRA, and that this decrease accelerates for a vPRA exceeding 85%. Figure 7.4 shows sensitivity checks for this result. For panel A models were re-estimated separately for German and non-German patients. The inverse relation between the vPRA and relative transplant rate is reproduced in both regions. An apparent difference between Germany and the other Eurotransplant member countries is that the relative transplant rates only appears to decrease for vPRAs greater than 50% for German candidates, while a decrease is visible over the whole domain for Eurotransplant’s other member countries. In panel B, we re-estimated models separately in patients registered before and after January 1, 2016, the study start state. This sensitivity check was motivated by the fact that candidates already on the waiting list on January 1, 2016 are a non-representative selection of the kidney transplant candidate population. The estimated spline curves are again very similar. In panel C, we assessed the impact of not using vPRA as a time-varying variable. The obtained curves differ minimally, although it appears that using time-fixed versions of the vPRA modestly increases effect sizes. Finally, in panel D we assessed sensitivity of our result to the availability of 0 DR-mismatched donors in Eurotransplant’s donor pool. Also here, no meaningful differences are found.
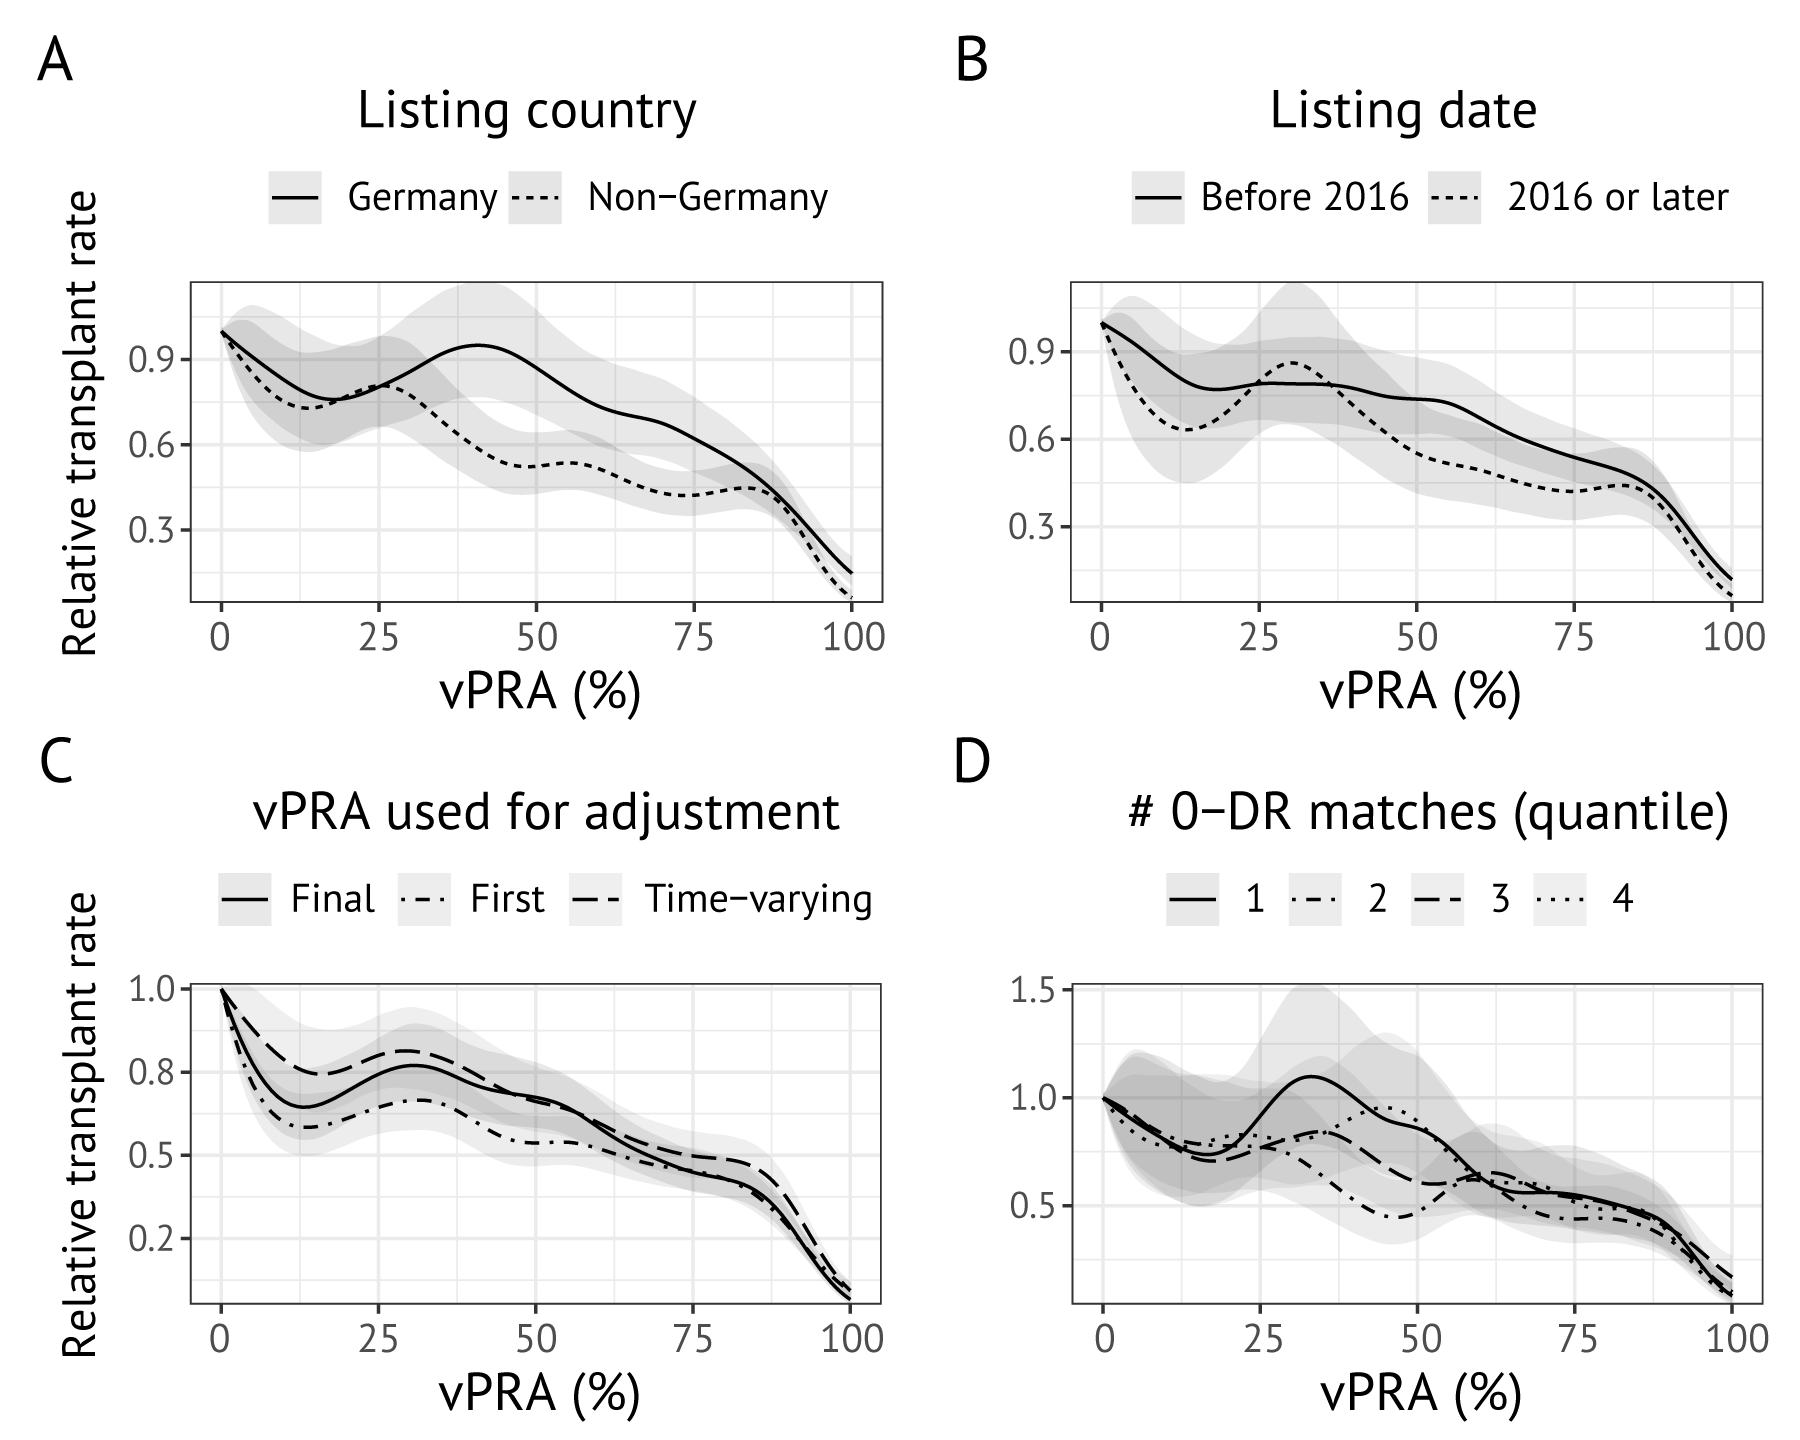
Figure 7.4: Sensitivity checks for the relation between the vPRA and relative transplant rate. Panel (a) shows penalized spline terms estimated separately for German allocation regions and Eurotransplant countries. Panel (b) shows penalized spline terms estimated separately for patients already on the waiting list on January 1, 2016, versus those registered afterwards. Panel (c) assesses whether the spline term is affected by whether a time-varying vPRA is used. Panel (d) shows how the relation between the relative transplant rate and vPRA varies by quantiles of the number of 0 DR-matchable donors. Panels (a), (b), and (d) use vPRA as a time-varying variable.
7.3.4 The association of the vPRA with ETKAS offer rates
The hazard ratios estimated for time-to-any-offer and time-to-high-quality-offer are shown in Table 7.2. The hazard ratios obtained for the time-to-any-offer analysis (first row, Table 7.2) differed minimally from the hazard ratios obtained for the relative transplant rate, at 28% lower for vPRAs 50-75%, 61% lower for vPRA 75–85%, and a strong decrease for vPRA >85%. When using a high-quality offer as an outcome the inverse relation also reproduces (second row), although estimated hazard ratios are attenuated. For example, patients with a vPRA between 75 and 85% have an approximate 33% lower high-quality offer rate than their non-immunized peers, while they have a 51% lower transplant rate and a 61% lower any-offer rate.
| 0.01-24.9% | 25-49.9% | 50-74.9% | 75-84.9% | 85-94.9% | 95-98.9% | 99-100% | |
|---|---|---|---|---|---|---|---|
| any offer |
0.93 (0.85-1.01) |
0.72 (0.66-0.79) |
0.56 (0.51-0.6) |
0.39 (0.35-0.44) |
0.27 (0.24-0.31) |
0.16 (0.14-0.19) |
0.06 (0.05-0.08) |
| high-quality offer |
0.88 (0.77-1.02) |
0.90 (0.78-1.03) |
0.72 (0.63-0.81) |
0.67 (0.56-0.8) |
0.51 (0.43-0.62) |
0.46 (0.37-0.57) |
0.20 (0.15-0.29) |
7.3.5 Mismatch probability points awarded for the vPRA
Immunized patients are indirectly awarded points in ETKAS through points awarded for the mismatch probability (MMP), which is a quantification of the frequency of favorably matched donors. Candidates with rare blood groups or difficult-to-match HLAs may receive very few extra points for being sensitized, as the MMP is by definition higher for candidates with rare blood groups or those with difficult-to-match HLA phenotypes. To highlight this, we calculated for all immunized patients the difference between mismatch probability points calculated based on their actual vPRA, and mismatch probability points with a vPRA of 0%. This difference is the number of mismatch probability points that the candidate received on the basis of their vPRA. Figure 7.5 shows the distributions of MMP points that the immunized patients in our cohort received based on the vPRA. Immunization indeed results only in a marginal increase in the number of points received for candidates with rare blood groups: the median sensitized candidate with blood group AB receives fewer than 20 additional MMP points, regardless of their vPRA. Moreover, a quarter of patients with the highest vPRAs (>85%) receive less than 50 mismatch probability points based on their vPRA. The number of additional MMP points awarded based on the vPRA thus appears meagre compared to the median number of ETKAS points needed for transplant through ETKAS, which exceeded 900 points between January 1, 2016, and January 1tab1, 2020.
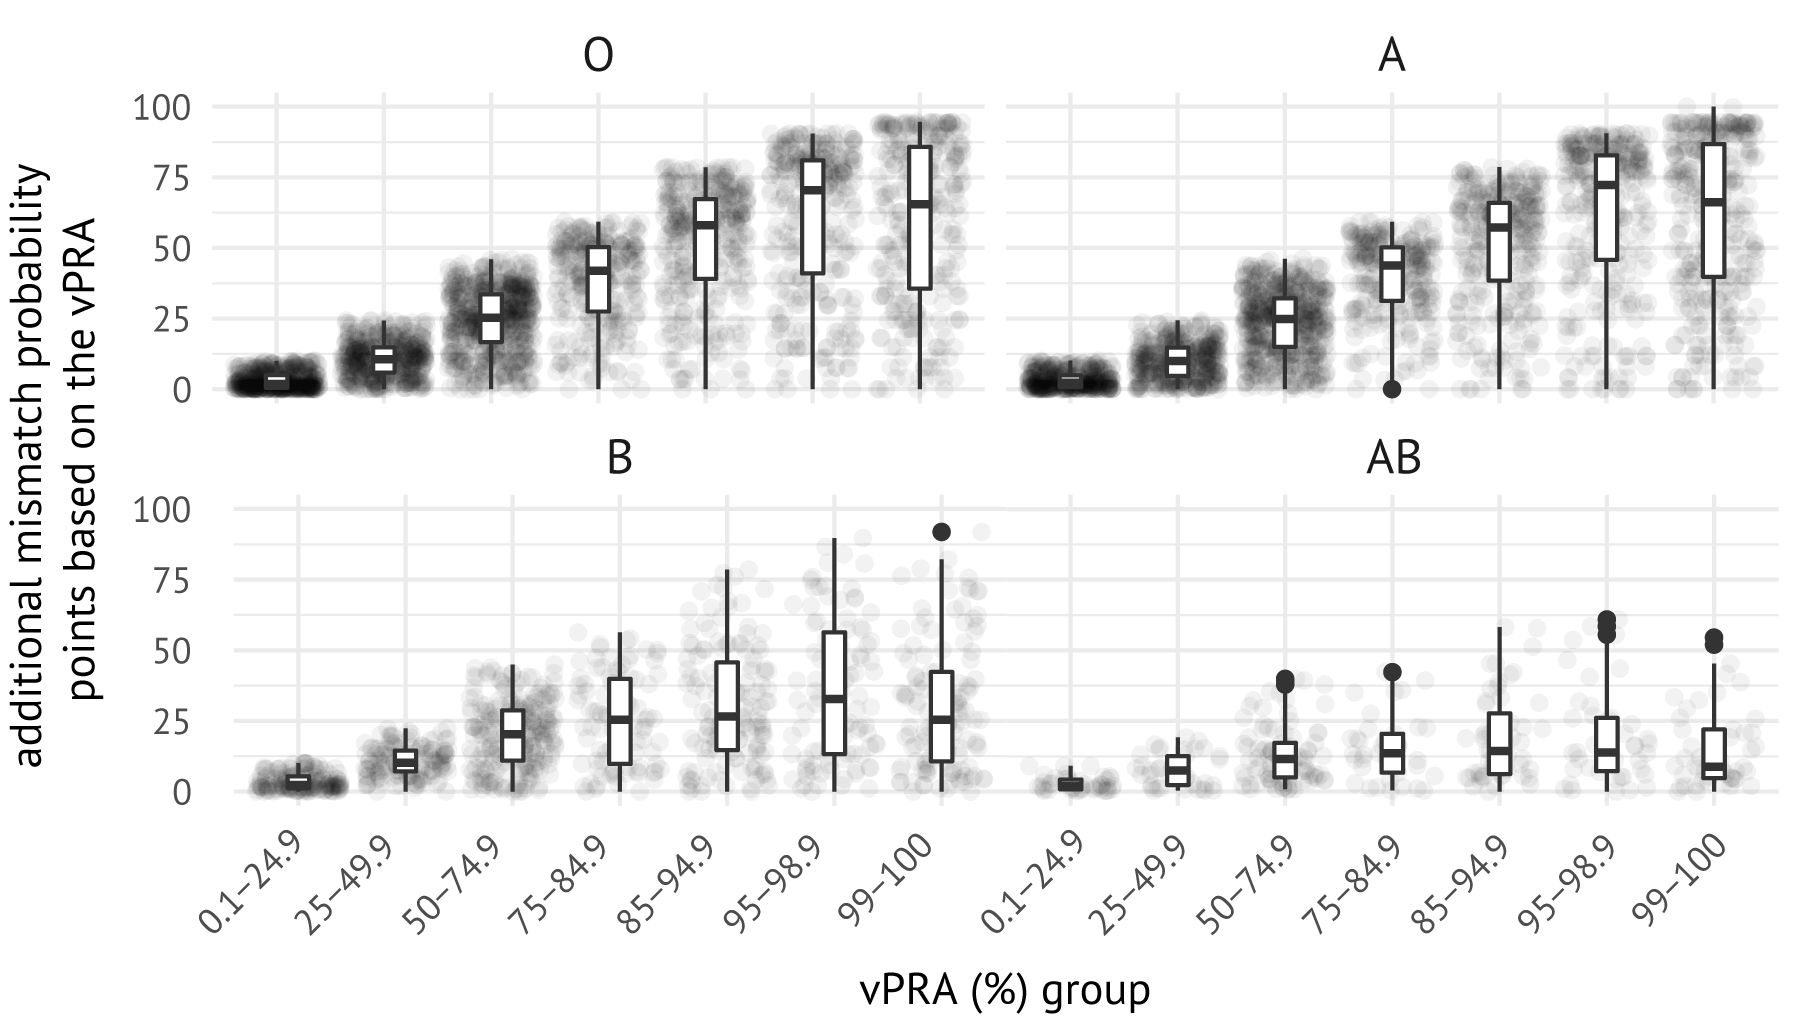
Figure 7.5: Mismatch probability points awarded to immunized patients based on their vPRA. Each dot represents an immunized patient in the cohort. Statistics were obtained by calculating the difference in MMP calculated with the actual vPRA versus the MMP calculated with a vPRA of 0%.
7.4 Discussion
More than 90% of immunized kidney transplant candidates in Eurotransplant rely on ETKAS for access to kidney transplantation. Concerns exist that these candidates are inadequately served by the mismatch probability points, and that they face extended waiting times [133], [134], [135]. This motivated us to study the relation between the vPRA and relative transplant rate in ETKAS. Our study is the first to quantify this relation Eurotransplant-wide, and complements two previous studies that used German cohorts [134], [135], We studied the relation with Cox regression stratified by blood group and recipient country, using accrued dialysis time as the timescale. In this analysis, we allowed for delayed entry and included the vPRA as a time-varying variable. This study design avoids some methodological issues of the previous studies. Dialysis time is a more appropriate timescale than Ziemann et al.’s time-since-listing, as ETKAS allocation prioritizes based on accrued dialysis time and not waiting time. Zecher et al. used total accrued dialysis time as the outcome, and associated this with the vPRA recorded on January 1, 2019, which was their study start date. This appears problematic as over half of the immunized patients change the set of unacceptable antigens during registration, which means that the vPRA recorded on January 1, 2019 is not pre-determined to their accrued dialysis time. Our analyses avoided this issue by allowing for delayed entry of transplant candidates (not modeling transplant rates before January 1, 2016) and using the vPRA as a time-varying variable.
Our results show that a higher vPRA is associated with significantly reduced relative transplant rates in ETKAS. Unlike prior studies, reductions in transplant rates are already highly significant for vPRAs below 85%, with transplant rates 23% lower for vPRAs from 0–50% (p < 0.001) and 51% lower for vPRAs 75–85% (p < 0.001). Transplant rates are even lower for candidates with vPRA exceeding 85%; for example, candidates with vPRAs greater than 99% face 94% lower transplant rates. We note that candidates with vPRAs exceeding 85% may still depend on access to transplantation through ETKAS, for example because their center does not participate in the AM program or because the candidate does not meet AM criteria (unacceptable antigens require CDC reactivity or documentation of a sensitizing event [153]). One possible reason why even candidates with very low vPRAs (0-10%) face reduced access to transplantation is that immunized candidates could not be selected in non-standard allocation in the study period, which accounts for approximately 10% of kidney transplantations in Eurotransplant.
A strength of our study is the inclusion of several sensitivity checks, which show that the inverse relation between vPRA and the transplant rate generalizes beyond Germany, is independent of whether the patient was listed before or after 2016, and is independent of the type of vPRA used (time-varying, first vPRA, or final vPRA). The difficulty of finding a high-quality match (defined as the number of donors with 0 HLA-DR matches) also does not affect the relation.
A limitation to our study is that attention was restricted to patients eligible for ETKAS only, with patients censored if they enrolled into the AM program or became eligible for ESP. Zecher et al. instead adjusted in their analyses for enrolment in the AM program. We did not pursue this, as AM allocation is not based on accrued dialysis time which makes the proportional hazards assumption implausible. Ziemann et al. and Zecher et al. both also studied time-to-transplant for ESP patients. We did not pursue this, as candidates can choose to continue their participation in ETKAS after their 65th birthday, and it is not clear how to correct for the resulting selection bias. Moreover, elderly patients listed in other Eurotransplant member countries can simultaneously participate in ETKAS and ESP, and it is unclear how to appropriately account for the simultaneous participation of candidates in these in our analysis. Another limitation to our study is that sensitization against HLA-DQA, -DPA and -DPB may further limit transplant rates due to positive physical cross-matches. These antibody specificities were not captured by the vPRA used in this analysis.
Our secondary analyses showed that the vPRA is also inversely related to ETKAS kidney offer rates, both when considering any offer as an outcome and when considering only high-quality offers as an outcome. This suggests that the reduced transplant rate for immunized patients is a result of ETKAS allocation, and not the kidney offer acceptance behavior of the transplant centers. We showed that many immunized patients receive only a marginal amount of additional MMP points based on their vPRA, in particular those with a difficult-to-match HLA or rare blood group. A potential policy implication of our work is thus that it seems worthwhile to revise the number of points that is awarded for the MMP, which has remained capped at 100 points since the introduction of ETKAS in 1996.
Finally, our work can help inform decision-making on whether to assign non-CDC reactive antigens as unacceptable. For ETKAS such decisions are made based on personalized risk assessments by doctors and local HLA laboratories, not on criteria prescribed by Eurotransplant. Our finding that increases in the vPRA beyond 85% strongly decreases the transplant rate may, for example, motivate local transplant professionals to be cautious in assigning antigens without CDC-reactivity as unacceptable for patients with already high vPRA (>85%). In this way, our work could help avoid situations where caution of local transplant teams unintentionally prolongs a candidate’s waiting time.