Chapter 5 The ELAS simulator
An article based on this chapter has appeared in Operations Research, Data Analytics and Logistics, de Ferrante, H.C., de Rosner-van Rosmalen M., Smeulders, B.M.L., Spieksma, F.C.R, Vogelaar, S., 2025, 10.1016/j.ordal.2025.200476 [84]
Abstract
In this chapter, we present the ELAS simulator. This discrete-event simulator was built for the Eurotransplant Liver Allocation System (ELAS), which is used by Eurotransplant to allocate the livers of deceased organ donors. The simulator closely mimics ELAS and has been made publicly available to (i) provide transparency regarding the models Eurotransplant uses to evaluate liver allocation policies, and (ii) facilitate collaborations with policymakers, scientists, and other stakeholders in evaluating policy changes to ELAS. In this chapter, we describe the design and the modules of the ELAS simulator. One of the included modules is the obligation module, which is instrumental in ensuring that international cooperation in liver allocation benefits all member countries of Eurotransplant.By default, the ELAS simulator simulates liver allocation according to the actual Eurotransplant allocation rules. Stochastic processes, such as graft offer acceptance behavior and listing for a repeat transplantation, are approximated with statistical models that were calibrated on data retrieved from the Eurotransplant database. We validate the ELAS simulator by comparing simulated waiting list outcomes to historically observed waiting list outcomes between January 1, 2016, and December 31, 2019.
The ELAS simulator has a modular design, which gives end users maximal control over the rules and assumptions under which Eurotransplant liver allocation is simulated. This makes the simulator useful for policy evaluation, as we illustrate with two clinically motivated case studies. For these case studies, we collaborated with hepatologists and transplantation surgeons from two liver advisory committees affiliated with Eurotransplant.
5.1 Introduction
The Eurotransplant Liver and Intestine Advisory Committee (ELIAC) plays a key role in developing liver allocation policies in Eurotransplant; ELIAC monitors the Eurotransplant liver allocation system (ELAS) and makes proposals to the Eurotransplant Board on how to improve liver allocation rules according to the latest medical insights. Since the introduction of MELD-based liver allocation in December 2006, ELIAC has brought forward several issues with ELAS; for example, it has been reported that ELAS overprioritizes candidates who receive exception points [54], and that MELD disadvantages candidates with small body sizes [76]. Despite the identification of such issues, the current liver allocation system has changed little since the initiation of MELD-based liver allocation in Eurotransplant.
An important reason for the lack of policy change in ELAS is that Eurotransplant has lacked tools that can help map the impact of allocation policy changes on liver waiting list outcomes. There is a long history of using operations research and discrete-event simulation for this purpose, with early work including the development of the UNOS Liver Allocation Model (ULAM) for U.S. liver allocation [85].
In the United States, this work has culminated in the Simulation Allocation Models (SAMs) [86], which is a family of discrete-event simulators maintained by the Scientific Registry of Transplant Recipients (SRTR). LSAM – SRTR’s tool for liver allocation [86] – is used routinely by the scientific community and policymakers to study alternative liver allocation rules. For example, LSAM has been used to study the impact of expanding MELD with extra biomarkers [20], [37], the impact of alternative geographic sharing rules [36], [87], [88], [89], [90], and the impact of policy changes that improve access to transplantation for specific patient groups such as pediatric and female patients [83], [91], [92]. Other organ allocation organizations also routinely note the use of simulators for evaluation of new liver allocation policies, for example in France [93] and the United Kingdom [19].
Simulation can thus play a key role in moving Eurotransplant’s liver allocation system forward. This was recognized by Eurotransplant in the late 1990s, when computer simulations motivated a switch from ABO blood group-identical liver allocation to the restricted ABO-compatible matching policies that are still in use today [14]. However, a simulation model developed specifically for Eurotransplant has not been available.
Existing simulation models are also not applicable to Eurotransplant. Such models typically simulate allocation for a single patient population, while Eurotransplant needs to balance the interests of the populations from its eight member countries. Moreover, existing models typically implement allocation rules that are specific to the country for which the simulator was designed. For example, allocation rules in LSAM emphasize the physical distance between the donor and transplantation candidate, as geographical sharing in the United States is primarily constrained by these physical distances. Conversely, in Eurotransplant, geographical sharing is mostly impeded by country borders. ELAS therefore gives priority to candidates who are located in the same country as the donor, and implements a mechanism that ensures that livers transplanted with priority across country borders are repaid to the exporting country. These mechanisms have not been implemented for existing simulation models, making these models a poor fit for Eurotransplant.
This has motivated us to develop a discrete-event simulator that is tailored to ELAS. We refer to this simulator as the ELAS simulator. Code for the ELAS simulator is implemented in Python and made publicly available together with synthetic data.2 By default, the ELAS simulator simulates liver allocation according to Eurotransplant allocation rules. The modular design of the simulator enables end users to use the simulator for policy evaluation.
It is clear that the development of the ELAS simulation could not be done, and was not done, in isolation. Multiple stakeholders were involved in various phases of the project. In particular, members of the Eurotransplant Liver and Intestine Advisory Committee (ELIAC), who are hepatologists and transplant surgeons who represent Eurotransplant’s member countries, have given feedback on numerous occasions on the conceptual design of the simulator; also, at Eurotransplant Annual Meetings, physicians and transplantation coordinators have commented on various aspects of the simulator.
This chapter is structured as follows. In Section 5.2, we give a description of Eurotransplant’s liver allocation system (ELAS). In Section 5.3 we discuss the design of the ELAS simulator, and give an overview of the general flow of the simulations. In Section 5.4, we describe important modules of the ELAS simulator, each of which emulates a key aspect of the liver allocation process. In Section 5.5, we discuss verification and validation of the ELAS simulator. In Section 5.6, we illustrate with two clinically motivated case studies that the ELAS simulator is useful for policy evaluation. We conclude and discuss in Section 5.7.
5.2 The Eurotransplant Liver Allocation System (ELAS)
We provide a simplified description of ELAS below. Comprehensive descriptions of ELAS are available elsewhere (see [35], [58]). Fundamental to ELAS is the laboratory MELD (lab-MELD) score, which quantifies a candidate’s 90-day waiting list mortality risk based on serum bilirubin, serum creatinine, and the INR [34]. However, candidate prioritization is not solely based on lab-MELD scores, because certain patient groups would be underserved by such an allocation. Specifically, ELAS also prioritizes candidates with:
the High Urgency (HU) status,
the Approved Combined Organ (ACO) status that is given to candidates who require a combined transplantation of a liver with a heart, lung, pancreas, or intestine,
pediatric MELD (PED-MELD) scores that are assigned automatically to candidates of pediatric age,3 and
Standard and Non-Standard exception (SE / NSE) MELD scores that can be awarded to patients who require access to liver transplantation for other reasons than a high short-term mortality risk.
When a liver becomes available for allocation, Eurotransplant runs the liver match algorithm against a central database in which candidates for liver transplantation are registered. This computer algorithm implements the prioritization mechanisms of ELAS. Based on all the waiting candidates, this algorithm returns a list of candidates eligible to receive the liver graft. This match list is ordered based on donor and candidate characteristics, and the order determines the sequence in which candidates are offered the liver graft by Eurotransplant. An actual Eurotransplant liver match list for an adult blood group A donor reported from the Netherlands is shown in Table 5.1.
At the highest level, the Eurotransplant match list order is based on match tiers. Candidates in higher tiers have priority over candidates in lower tiers. The first ELAS tier consists of candidates with the High Urgency (HU) status. The second tier consists of candidates with the Approved Combined Organ (ACO) status. Candidates with HU or ACO status are given international priority in Eurotransplant. A payback mechanism is used for grafts accepted internationally in HU and ACO tiers. Specifically, international HU / ACO transplantations create an obligation for the receiving country to offer the next available liver within the same blood group to the donor country until the obligation is settled (see Section 5.4.2 for more information). Candidates without an HU or ACO status are referred to as elective candidates in Eurotransplant. These elective candidates are ranked in the remaining tiers.
Whether candidates appear on the match list and the rank at which they appear is jointly determined by patient eligibility criteria (blood groups), ranking criteria (MELD, pediatric status, donor/recipient blood group combination), and filtering criteria (patients can indicate that they do not want to be considered for certain donors with allocation profiles). These patient eligibility criteria, ranking criteria, and filtering criteria are multi-factorial and differ between the member countries of Eurotransplant.| tier | offered to | candidate country | rank | match-MELD | lab-MELD | (N)SE-MELD | candidate blood group | accepted? |
|---|---|---|---|---|---|---|---|---|
| HU | patient | Austria | 1 | 25 | AB | No | ||
| elective |
center (29 patients) |
Croatia | 2 | No | ||||
| patient | Belgium | 3 | 28 | 16 | 28 | A | No | |
| 4 | 22 | 22 | A | No | ||||
| 5 | 20 | 8 | 20 | A | No | |||
| 6 | 20 | 20 | A | No | ||||
| 7 | 17 | 17 | A | No | ||||
| 8 | 17 | 17 | A | No | ||||
| 9 | 16 | 16 | A | No | ||||
| 10 | 15 | 15 | A | No | ||||
| 11 | 14 | 14 | A | No | ||||
| 12 | 14 | 14 | AB | No | ||||
| 13 | 14 | 14 | A | No | ||||
| 14 | 13 | 13 | A | No | ||||
| 15 | 13 | 13 | A | No | ||||
| 16 | 9 | 9 | A | No | ||||
| 17 | 9 | 9 | A | No | ||||
| 18 | 9 | 9 | A | No | ||||
| 19 | 8 | 8 | A | No | ||||
| 20 | 8 | 8 | A | No | ||||
| 21 | 6 | 6 | A | No | ||||
| 22 | 35 | 35 | A | Yes |
A rule common to all countries is that elective candidates listed in the same country as the donor have priority over elective candidates listed in other countries. Other factors that affect the ranking of candidates include the combination of the donor and candidate blood groups, whether the donor and/or candidate are pediatric, whether the adult is low-weight (<55 kg), as well as where the candidate is located geographically relative to the donor (same center, same region, same country, or different countries). The order of the match list in elective tiers is also affected by the existence of obligations. For example, when the match list shown in Table 5.1 was created, the Netherlands had an obligation to offer a blood group A liver to Croatia. Consequently, in the elective tier all Croatian candidates were ranked above the Dutch candidates. The most important factor for ranking candidates in elective tiers is the match-MELD score (see Table 5.1). This match-MELD score is the maximum of a candidate’s lab-MELD score and any received exception points (PED-MELD, SE-MELD, or NSE-MELD). We point out that exceptional scores (SE-MELDs or NSE-MELDs) are valid only for national allocation or when an offer is based on an obligation to pay back a liver.
Most offers in ELAS are recipient-driven, which means that Eurotransplant offers the liver graft to a named candidate [35]. Under specific circumstances, Eurotransplant makes a center offer to candidates, which means that centers are allowed to select any blood group compatible candidate from their waiting list for transplantation. Offers to Croatia based on an obligation are an example of center offers, which explains why a single offer to 29 Croatian patients appears on the match list in Table 5.1. The position of center offers on the match list is determined by the highest rank that is achieved by any candidate listed in the center in elective tiers. We note that national regulations differ on when offers are center-driven. These rules are described in the Eurotransplant liver manual (see [58]).
The order of the match list determines the sequence in which Eurotransplant contacts centers in standard allocation. In cases where the loss of a transplantable graft is anticipated, Eurotransplant can deviate from this allocation order (see [35], [58]). For example, Eurotransplant is allowed to start an extended allocation procedure 2 hours before the planned explantation procedure (1 hour in Germany). Centers in the vicinity of the donor center are then contacted, and are given 30 minutes to propose up to two candidates for transplantation. The proposed candidate with the highest rank on the match list is then selected for transplantation. If extended allocation is unsuccessful, Eurotransplant can also offer the graft to centers located further away from the donor center on a first-come, first-served basis with competitive rescue allocation. In total, 20% to 25% of liver grafts are transplanted through non-standard allocation mechanisms [35]. Extended allocation accounts for the majority of these placements.
5.3 The design of the ELAS simulator
The ELAS simulator was designed to enable end users to assess the impact of changes to the liver allocation rules on waiting list mortality rates and access to transplantation. We follow existing literature by using discrete-event simulation (DES) for this purpose [85], [86], [94], [95]. With DES, complex processes are analyzed by determining how system states are affected by a sequence of discrete events. Within the ELAS simulator, the system states are (i) the statuses of transplant candidates (whether they remain alive, their last known MELD score, their accrued waiting time, and other information used in allocation), and (ii) obligations to return a graft. The discrete events which affect these system states are (i) patient events, which directly modify the candidate’s state (e.g. updates to the MELD score), and (ii) liver donation events, which generally lead to the transplantation of a candidate, and which may result in the creation or redemption of an obligation to pay back a liver graft.
Which candidate is transplanted when a donor becomes available is affected by several stochastic processes. One such process is the graft offer acceptance behavior of the transplant centers. Such behavior plays a key role in liver allocation because the transplant centers frequently decline liver grafts they deem unsuitable for their candidates.4 Another stochastic process is that recipients of a liver transplant can experience a early graft failure, and may be listed for a repeat transplantation. To accurately simulate outcomes of the Eurotransplant liver allocation process, the ELAS simulator also has to mimic these stochastic processes.
For discussion of the design of the ELAS simulator, we find it helpful to distinguish between
the organ allocation environment, with which we refer to the overall setting in which allocation policies operate. This environment is deterministically defined by the simulation settings and input streams. Of key importance are the simulation input streams, which are the datasets that define the donors which become available for transplantation, the candidates who appear on the liver waiting list, and the donor and patient events that drive ELAS simulations. These input streams also specify the nested structure of agents in the ELAS simulations: donors and patients are nested in hospitals and transplant centers, which are in turn nested in the Eurotransplant member countries. The organ allocation environment has to be specified in advance of any simulation. We discuss the requirements for input streams in Section 5.3.1. How simulations are initialized based on input streams is discussed in Section 5.3.2. How simulations proceed is illustrated in Section 5.3.3, and
simulation modules, which are implemented in Python code. These modules emulate key aspects of the liver allocation procedure. These processes include the generation of liver match lists according to ELAS’ liver allocation rules, the simulation of graft offer acceptance behavior, ELAS’ obligation system, and ELAS’ exception point system. We discuss the implemented modules in Section 5.4.
With this overall design, the ELAS simulator is similar to LSAM, the simulator that has been used extensively to study organ allocation in the United States. We also point out several differences. Most importantly, the ELAS simulator is developed specifically for Eurotransplant, and takes into account the multi-national setting; we include international sharing rules and allow for allocation rules to differ per country. Other major differences include that (i) centers can decline liver offers for all their candidates in ELAS simulations, (ii) the ELAS simulator can approximate outcomes of non-standard allocation while LSAM always places livers through standard allocation, (iii) organ offer acceptance models specific to pediatric candidates are included, (iv) the splitting of liver grafts is simulated, and (v) simulation of re-listing for repeat transplantation is based on historical re-listing data.
5.3.1 The organ allocation environment
To simulate liver allocation with the ELAS simulator, users must provide input streams. These input streams consist of donor and patient information, which is used by the ELAS simulator to construct the discrete events that drive the simulator. Users of the ELAS simulator are free to base these input streams on actual registry data, reordered registry data, synthetic data, or combinations thereof. Ideally, the choice on which input stream is used is based on the end user’s research question of interest. For example, end users interested in evaluating the impact of small changes to allocation rules may use historical data from the Eurotransplant registry for simulation, while end users interested in evaluating the effect of an expansion to the donor pool may need to extend the historical donor pool with synthetic donor data.
The input stream for donors must specify all the administrative and medical information that is required for liver allocation, for predicting the acceptance of liver offers, or for predicting post-transplant survival. Such information includes the donor reporting date, the donor hospital and donor reporting center, the donor weight and height, the donor blood group, and the donor death cause. In the ELAS simulator, this information is static and represents the state of the donor on the day they were reported to Eurotransplant.
Basic administrative and medical information necessary for allocation is also required for the input streams for transplant candidates. Such information includes the candidate’s center of listing, the candidate’s disease group, the candidate’s age and weight, and the candidate’s blood group. To identify candidates listing for a repeat transplantation, a candidate identifier must be specified. Next to this static candidate information, dynamic information is required on the evolution of candidate’s medical condition while they await liver transplantation. For this, the ELAS simulator requires an input stream of candidate status updates. These status updates specify when and how a candidate’s state changes while they wait on the Eurotransplant waiting list. Examples of such status updates are new biomarker measurements, the reception of exception scores or upgrades thereof (NSE / SE / PED-MELD), changes to the candidate’s waiting list status (HU / ACO / NT status), and an exit status for each candidate (waiting list removals or waiting list deaths). Because candidates regularly modify their allocation profiles, profiles were also implemented as status updates. With these allocation profiles, centers can indicate that a candidate does not want to receive offers from certain liver donors. For example, many candidates specify that they do not want to be offered grafts from donors above a certain age threshold.
Discrete-event simulators for organ allocation require complete knowledge on what would happen to a candidate if they would remain on the waiting list until waiting list death or waiting list removal. For candidates transplanted in reality, such information is necessarily partly counterfactual; after all, transplantation prevents us from observing what would have happened to the transplanted candidate if they had remained on the waiting list. For other simulators, this counterfactual status problem was tackled by complementing the real statuses of a transplanted candidate with statuses copied over from a similar but not-yet-transplanted candidate [86], [94]. We propose a procedure that completes the status updates of transplanted candidates in this way, and describe this procedure in detail in Appendix B.
To summarize it briefly, the procedure first constructs a risk set for each transplanted candidate. This is a set of candidates who (i) remain on the waiting list, (ii) are similar to the candidate on a set of pre-specified characteristics, and (iii) face similar 90-day mortality risks in the absence of transplantation. A complete status update trajectory can then be constructed by (i) randomly sampling a candidate from the risk set, and (ii) copying over the future status updates from the sampled candidate. By running this procedure repeatedly, we construct for each candidate multiple potential status update trajectories. This allows us to also quantify the uncertainty in this status update completion procedure in simulations.
5.3.2 Initialization of the ELAS simulator’s system state
End users of the ELAS simulator must specify a simulation start and end date, which jointly define the simulation time window. When the simulation starts, the system state is initialized by loading from the input streams all the donors who were reported during the simulation window, and all the candidates who had an active waiting list status during the simulation window. For the loaded candidates, all status updates are pre-processed until the simulation start date. This ensures that the states of candidates at simulation start coincide with their actual status on the simulation start date, as specified in candidate input streams.
A potential problem is formed by candidates who (i) have in reality received a transplantation after the simulation start date and (ii) were listed for repeat liver transplantation before the simulation end date, as these candidates could simultaneously await a primary and repeat transplantation in simulation runs. To prevent this, the ELAS simulator by default ignores re-listings of such candidates from the candidate input stream. Instead, patient re-listing is simulated by the post-transplant module. This module simulates the post-transplant survival, and the potential re-listing of transplant recipients based on candidate and donor characteristics (see Section 5.5.2.1).
The initialization of the discrete-event simulation is finalized by scheduling for each donor and transplant candidate a single event in the Future Event Set (FES). For donors, events are scheduled at the donor reporting date that is specified in the donor input stream. For each candidate, a single patient event is scheduled at the time of the candidate’s first available status update after the simulation start date. Subsequent updates are scheduled in the FES only after the existing patient event has been handled.5
5.3.3 Overview of the simulation

Figure 5.1: Event handling flowchart for the ELAS simulator. Inputs and parameters are represented using parallelograms. D, deceased on the waiting list; ELAS, Eurotransplant Liver Allocation System; FES, Future Event Set; MELD, Model for End-Stage Liver Disease; R, waiting list removal.
Figure 5.1 shows how patient and donor events from the FES are processed in the ELAS simulator. In case of a patient event, the corresponding candidate’s status is updated according to their earliest scheduled status update. In case a donor event is processed, a match list is created. To appear on this match list, candidates must have an active waiting list status (T, HU, or ACO) and they must be compatible with the donor according to ELAS blood group rules. The entities that appear on these match lists are offers to patients and center offers (if applicable). These offers are ordered deterministically based on the allocation rules specified in the organ allocation environment. By default, the actual ELAS allocation rules are followed, which are summarized in Section 5.4.1.
The ordered match list serves as an input to the graft offering module (see Section 5.4.4). This module mimics the graft offering process in Eurotransplant and returns the candidate who accepts the liver offer, if any. We point out that it is not clear based on the match list alone which candidate is transplanted with the liver. One reason for this is that offers are regularly declined by the transplant centers: in fact, over half of the transplanted liver grafts in Eurotransplant were declined by 10 or more candidates before being accepted for transplantation. A second reason is that Eurotransplant can deviate from the standard allocation procedure to prevent the loss of transplantable organs (see Section 5.2). In simulating whether a candidate accepts the offer, the module can simulate both standard and non-standard allocation.
The ELAS simulator assumes that the candidate who accepts the liver graft is transplanted, and removes any scheduled events for this transplanted candidate from the Future Event Set. If a liver was allocated across country borders in HU or ACO tiers, the obligation system module creates an obligation for the importing country to return a liver graft in the future (or settles an obligation for the exporting country, in case an existing obligation exists). For livers exported based on an obligation, obligations are also settled. The post-transplant module simulates a time-until-liver-failure for each transplantation (see Section 5.5.2.1). In case the transplant recipient is simulated to be listed for a repeat liver transplantation before the candidate’s simulated death date, the post-transplant module schedules a “synthetic” re-listing for the candidate (see Section 5.4.5.3).
The processing of patient and donor events continues until the simulation end date is reached. At the end of the simulation, information on transplantations is written to an output file. A list of discarded grafts is also written to output files, as are the final states of all candidates present in the simulation. These final states include candidate exit statuses (waiting, waiting list death, transplanted, or waiting list removal), as well as their last reported MELD scores. Such information may be summarized to calculate the statistics relevant for a specific research question. We chose to write raw information to files rather than predefined summaries of information to give end users maximum flexibility in reporting more complicated statistics.
5.4 Modules of the ELAS simulator
This section describes the key modules of the ELAS simulator: the match list module (Section 5.4.1), the obligation system module (Section 5.4.2), the exception module (Section 5.4.3), the graft offering module (Section 5.4.4), and the post-transplant module (Section 5.4.5).
5.4.1 The match list module
When a liver graft is to be allocated, the match list module creates an ordered list of candidates who sequentially receive offers until a candidate accepts the liver graft. To appear on these match lists, candidates must (i) have an active waiting list status (transplantable, HU, or ACO), and (ii) have a blood group compatible with that of the donor, according to ELAS allocation rules. By default, the match list module collapses offers to candidates who are eligible for center offers into a single center offer object. The rank of this center offer is set equal to the rank of the top-ranked candidate eligible for that center offer. The match lists returned by the match list module are thereby ordered lists of center-driven and patient-driven offers, coinciding with the structure of match lists Eurotransplant actually uses for allocation (see the example match list in Table 5.1).
The precise ordering returned by the match list module is based on the liver allocation rules that must be pre-specified as part of organ allocation environment. The rules made available with the ELAS simulator are the ELAS allocation rules used between 2016 and 2024. end users of the ELAS simulator can modify these allocation rules to study waiting list outcomes under alternative allocation policies. Technically, the ranking of ELAS match objects (patient- or center offers) is based on match codes. These match codes consist of several components. The values of these components are determined by Eurotransplant allocation rules, donor and patient characteristics, and the existence of obligations. Currently, these match codes consist of:
- match tiers, which are used to give international priority to patients with HU status or ACO status,
- match layers, which differ per country and are used to give priority to certain patient groups (for example, to pediatric candidates, to blood group-identical candidates, to local candidates, or to candidates located in other countries based on obligations),
- match obligation ranks, which are used as a tiebreaker in case the donor country has obligations to return livers to multiple countries,
- match-MELDs, which are used to rank candidates in the elective tiers,
- match locality, which is used to prioritize patients regionally in Germany in elective tiers,
- waiting time, which is the number of days with a HU or ACO status in the HU and ACO tiers. In elective tiers, waiting time is defined as the number of days a candidate has had a match-MELD score at least as high as the current match-MELD score,
- the patient listing date, which is used as a tiebreaker.
The order of the match list is based on the lexicographical ordering of these components.
5.4.2 The obligation system module
An important feature of Eurotransplant’s obligation system is that obligations within the same blood group are automatically linked. For example, if Croatia has an obligation to return a blood group A liver to Belgium, and an obligation is created for Belgium to return a blood group A liver to Germany, the two existing obligations are replaced by a linked obligation for Croatia to return a blood group A liver to Germany.
The obligation module implemented for the ELAS simulator creates obligations for grafts that are procured internationally in HU or ACO tiers, and automatically replaces linkable obligations by a linked obligation. The module can also return for a given blood group the outstanding obligations per country, as well as the number of days these obligations have existed. This information is required by the ELAS simulator’s match list module to determine match obligation ranks.
5.4.3 The exception score module
Patient groups who are considered to be underserved by a purely lab-MELD-based allocation can apply for standard (SE) or non-standard (NSE) exceptions in ELAS. Candidates who receive such (N)SE and PED-MELD scores are awarded predefined 90-day mortality equivalents, which are specified in percentages. The exceptions, their eligibility criteria, and their 90-day mortality equivalents vary by member country. For example, in the Netherlands candidates with hepatocellular carcinoma are awarded a 10% mortality equivalent, while a 15% mortality equivalent is awarded in Belgium. Pediatric patients in Eurotransplant automatically receive PED-MELD scores based on their age, which are also based on 90-day mortality equivalents.
For allocation, these mortality equivalents are translated to the MELD scale. For example, a 10% and 15% mortality equivalent correspond to MELD scores of 20 and 22, respectively [58]. The awarded 90-day mortality equivalent increases every 90 days6 for most (N)SEs and PED-MELDs, according to exception- and country-specific increments. Some exceptions are implemented as “bonus SEs”. These bonus SEs add a fixed percentage mortality equivalent to the lab-MELD’s 90-day mortality equivalent.7
The exception score module implements this system, and is initialized based on an external file. This file has to specify which exceptions exist, and relevant exception attributes (the initial mortality equivalent awarded, the 90-day increment, the maximal equivalent awarded, the maximum age after which the exception no longer increases, and whether the SE is a regular SE or a bonus SE). For the default organ allocation environment, all (N)SEs and PED-MELDs existing in 2023 were implemented. end users may modify the attributes of these exceptions to simulate Eurotransplant liver allocation under alternative (N)SE / PED-MELD rules. Simulation settings also have to include parameters for the formula used to translate 90-day mortality equivalents to the MELD scale.8
By default, the ELAS simulator assumes that the candidate status input stream also specifies when exceptions are upgraded or expire. In case no future exception status is present in the candidate status queue for an NSE / SE / PED-MELD, the ELAS simulator assumes that the candidate would continue to re-certify their exception according to the exception-specific re-certification schedule. This choice is motivated by the fact that almost all candidates with exceptions re-certify them.
5.4.4 The graft offering module
For a match list, the graft offering module returns the candidate who accepts the graft offer (if any), or indicates that all eligible candidates have rejected the offer. If the graft has been turned down for all eligible candidates, the simulator can either (a) force placement of the graft in the candidate who was most likely to accept the graft offer, or (b) record a discard.
The graft offering process is mimicked by (i) offering liver grafts to patients/centers in order of their ranking on the match list, and (ii) modeling organ offer acceptance as a Bernoulli process, with acceptance probabilities predicted based on logistic models that using donor and patient characteristics (as in the SAM software, see [96]). The graft offering module also includes a logistic model to predict whether a liver graft is split by the transplant center after acceptance. Such split procedures allow centers to transplant two candidates with one liver, and are typically performed to transplant one pediatric and one adult patient.
There are several reasons why a candidate may not be offered a liver in ELAS allocation despite being ranked high enough for an offer. These reasons include that:
Centers frequently decline the graft for all candidates who appear on the match list, even when making patient-driven offers (for example because of poor donor quality or capacity constraints). If centers decline for the entire center, the center will not be contacted again with an offer for the transplantation of a specific patient.
Offers are not made to candidates whose allocation profiles exclude them from being offered the liver graft (for example because the donor is too old).
Center offers are not directly offered by Eurotransplant to individual candidates. Instead, the transplant center chooses a candidate for transplantation.
Eurotransplant can deviate from the standard allocation procedure in case allocation time is limited. Offers to candidates not located in the vicinity of the graft are then bypassed.
These reasons motivated us to
Implement a two-stage patient-driven offer acceptance procedure. In the first stage, a center-level logistic model is used to predict based on donor characteristics alone whether the center is willing to accept the graft. Provided that the center is willing to accept the graft, a patient-level logistic model is used to predict graft offer acceptance based on patient and donor characteristics.
Skip offers to elective candidates whose allocation profiles indicate that they do not want to receive the liver graft.
Estimate logistic regressions separately for center- and patient-driven offers.
Approximate deviation from standard allocation (see 5.4.4.1).
In the ELAS simulator, separate logistic models are used for four candidate groups: (i) pediatric candidates with HU / ACO statuses, (ii) elective pediatric patients, (iii) adult candidates with HU / ACO statuses, and (iv) elective adult candidates. This stratification is motivated by findings in the existing literature that a single acceptance model poorly captures offer acceptance behavior for specific patient groups. For example, Wood et al. [97] note poor prediction for pediatric patients in LSAM.
To enable end users to change how graft offer acceptance decisions are made, the odds ratios necessary for calculating the graft offer acceptance probabilities are kept in csv files external to the program. Default odds ratios supplied with the ELAS simulator were estimated based on offers of whole liver grafts procured between January 1, 2012 and December 31, 2019. When estimating these odds ratios, we ignored offers that were incompatible with the allocation profiles of candidates and offers that were accepted in non-standard allocation. To account for correlations in organ acceptance behavior, odds ratios were estimated with mixed effect models. In these models, we included random effects for donor heterogeneity (as in [98]), patient heterogeneity, and center heterogeneity.
5.4.4.1 Simulation of non-standard allocation
Approximately 25% of livers are placed through non-standard allocation in Eurotransplant. Without approximating such deviation from non-standard allocation, the ELAS simulator would place too many grafts nationally in Belgium and Germany, as both countries have implemented rules to prioritize local offers in non-standard allocation. This motivated us to approximate deviation from standard allocation in the graft offering module.
To address this, we approximate the initiation of non-standard allocation by
simulating the maximum number of offers until non-standard allocation is initiated with a Cox proportional hazards model. This Cox model models the probability that non-standard allocation is triggered based on donor characteristics (malignancy, death cause, drug abuse, marginal donor criteria, virology), using the number of offers made as the timescale. The Cox model was stratified by donor country and blood group. The baseline hazards for this Cox proportional hazards model are shown in Figure 5.2.
offering the graft in the order of the match list, while maintaining a count of the number of offers made,
if the maximum number of offers is reached
stop offering the graft to candidates whose allocation profiles exclude rescue donors,
give priority to regional candidates in Germany and to local candidates in Belgium.
In counting the number of offers made, a center-level rejection is counted as a single offer, and a candidate-level rejection is counted only if (a) the graft was compatible with the candidates allocation profile and (b) the graft was previously rejected by fewer than five candidate from the same center.
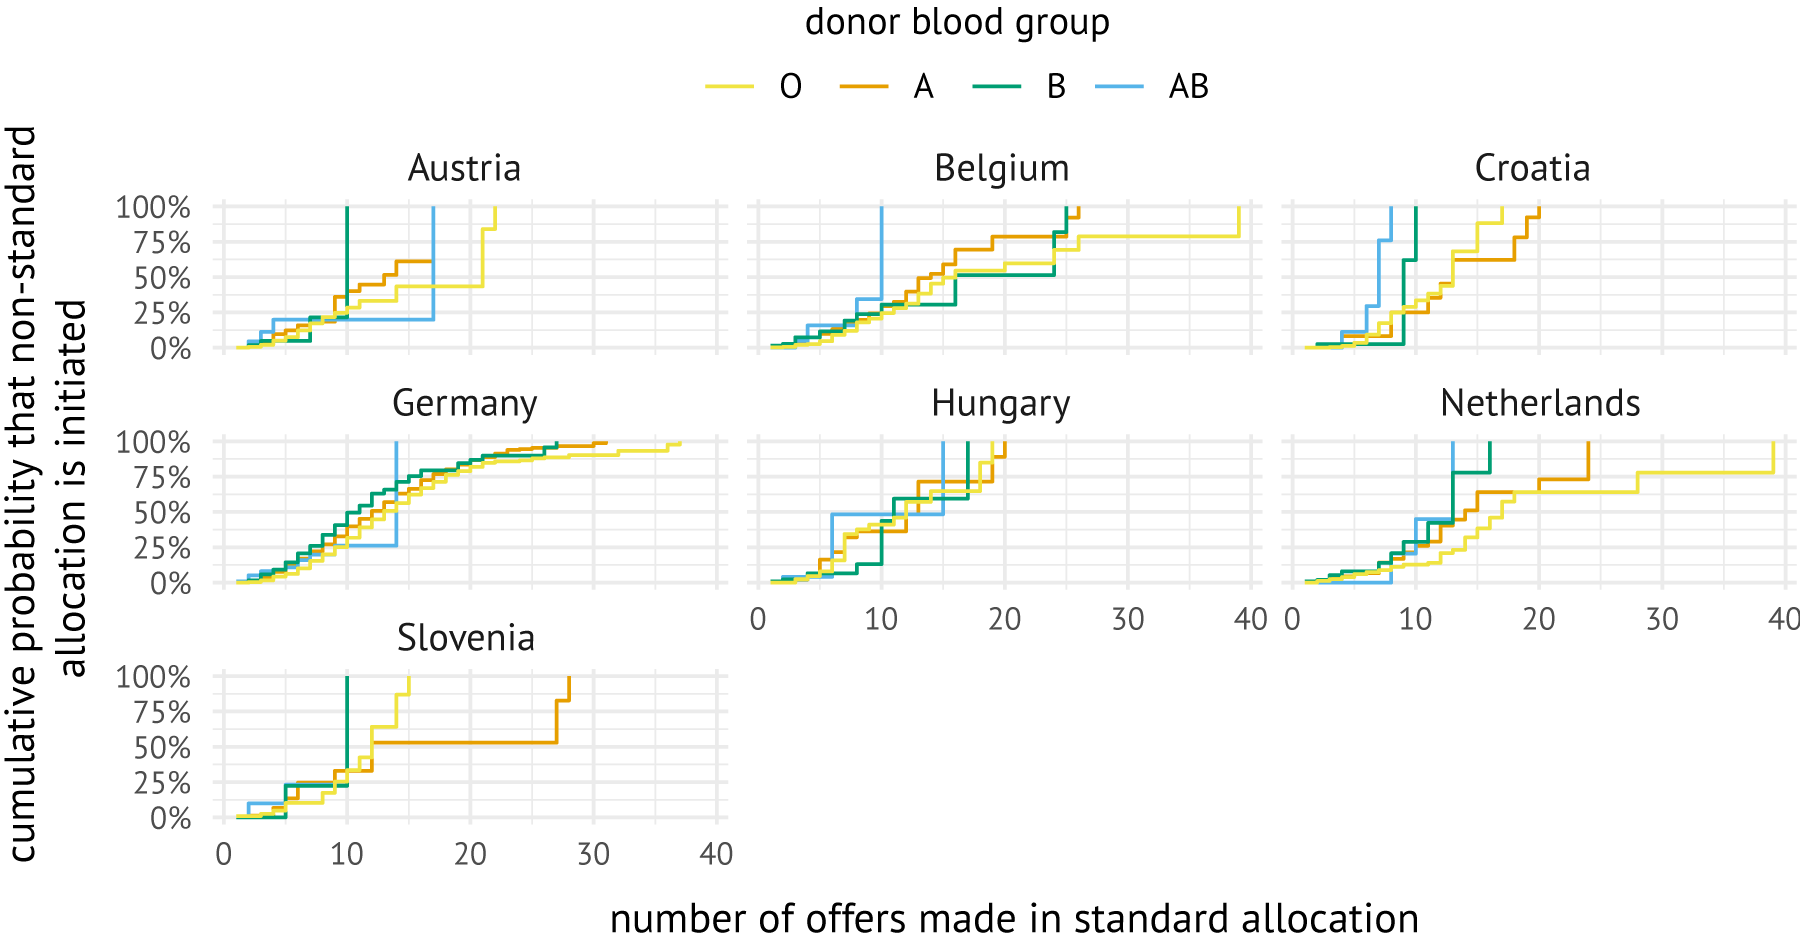
Figure 5.2: The relation between the number of offers made in standard allocation and the probability that non-standard allocation is initiated. The country- and blood group-specific survival curves were generated by predicting the number of offers for an average patient.
We note that this implementation is a heavily simplified representation of non-standard allocation in Eurotransplant. Because candidates are still prioritized based on the match list order, this implementation is closer to extended allocation than to rescue allocation (which operates on a first-come, first-served basis). Implementing competitive rescue allocation was not pursued because (i) it is not clear from donor information alone when competitive rescue allocation is initiated, (ii) there are three types of competitive rescue allocation in Eurotransplant, and (iii) not all centers are willing to accept grafts via competitive rescue allocation [58].
5.4.5 The post-transplant module
Over 10% of liver waiting list registrations in Eurotransplant concern candidates who are listed for a repeat liver transplantation. To accurately simulate such re-listings, a post-transplant module was implemented for the ELAS simulator. Upon transplantation, this module simulates a time-to-failure \(t\), defined as the time at which the candidate would die in absence of re-transplantation. \(T\) is modeled using a Weibull distribution, with parameters for recipient and donor characteristics. The module also simulates a time-to-relisting \(r\), at which the candidate enlists for a repeat transplantation. Finally, if a candidate is simulated to list for a repeat transplantation, the post-transplant module adds a listing for the repeat transplantation of that candidate to the waiting list. The parameters needed to simulate the post-transplant survival of liver transplantation recipients were estimated on Eurotransplant liver transplantations between January 1, 2012 and December 31, 2019. Since we expected post-transplant survival and re-listing to be different for elective candidates and those with the HU or ACO status, we estimated the parameters separately for these groups.
5.4.5.1 Simulating time-to-failure for transplant recipients
A Weibull model is used to simulate a time-to-event until patient death or liver transplantation, separately for HU/ACO and elective candidates. The used Weibull distribution is parametrized with a shape parameter \(k\) and scale parameter \(\lambda = \beta^{\mathsf{T}}x,\) where \(x\) are relevant patient and donor characteristics. The survival function for the Weibull distribution is given by:
\[S(t|x) = \exp\Bigg(-\Big(\frac{t}{\beta^{\mathsf{T}}x}\Big)^k\Bigg).\]
After obtaining estimates for \(\beta\) and \(k\) based on historical data using Weibull regression, a time-to-event \(t_i\) for a patient-donor pair \(i\) can be simulated by inverse transform sampling from this distribution. Specifically, we can draw a random number \(u \sim \texttt{unif}(0,1)\) and simulate a patient’s time-to-event as
\[t_i = \hat{\mathbf{\beta}}^{\mathsf{T}} \mathbf{x_i} \Big(-\ln(u)^{\frac{1}{k}}\Big).\]
By default, post-transplant survival of elective candidates is simulated based on a broad set of patient attributes (MELD biomarkers, patient age, country, sex, exception scores, BMI), donor attributes (year reported, donor age, split, DCD or DBD, death cause, malignancy, tumor history), and match attributes (candidate-donor weight difference, travel time, blood group compatibility, match geography). Paucity of data on HU and ACO transplantations motivated us to adjust for fewer variables in the non-elective model (weight difference, donor death cause, donor age, patient age, lab-MELD score, match geography, and an indicator for transplant history). Country-specific shape parameters are used to simulate \(t\) for elective candidates, while a single shape parameter is used to simulate it for candidates with the HU or ACO status.
5.4.5.2 Simulating a time-to-relisting \(r\) for transplant recipients
The simulation of a candidate’s time-to-relisting is complicated by the fact that a patient’s time-to-relisting \(r_i\) necessarily has to occur before their time-to-failure \(t_i\). To simulate re-listing times in the ELAS simulator, we estimated the probability of re-listing using the Kaplan-Meier estimator, with the time elapsed relative to the event time \(t_i\) as the timescale. A re-listing time can then be simulated by inverse transform sampling from the Kaplan-Meier curve, i.e., (i) sample a random \(u \sim \text{unif}(0,1)\), (ii) choose the first \(s\) such that \(\mathbb{P}[R/T > s] \geq u\), and (iii) calculate the time-to-relisting as \(s \cdot t\).
In case no such \(t\) exists, the patient will die without being listed for repeat transplantation. The estimated empirical distribution of \(R\) relative to \(T\) is shown in Figure 5.3, stratified by discretized \(T\). The figure shows that the fraction of patients who have died without having listed for repeat transplantation depends strongly on their time-to-failure \(T\). For example, almost 70% of candidates who experience an event within one week after transplantation are listed for a repeat liver transplantation, while only 20% of candidates who experience an event more than five years after initial transplantation are listed for repeat transplantation.
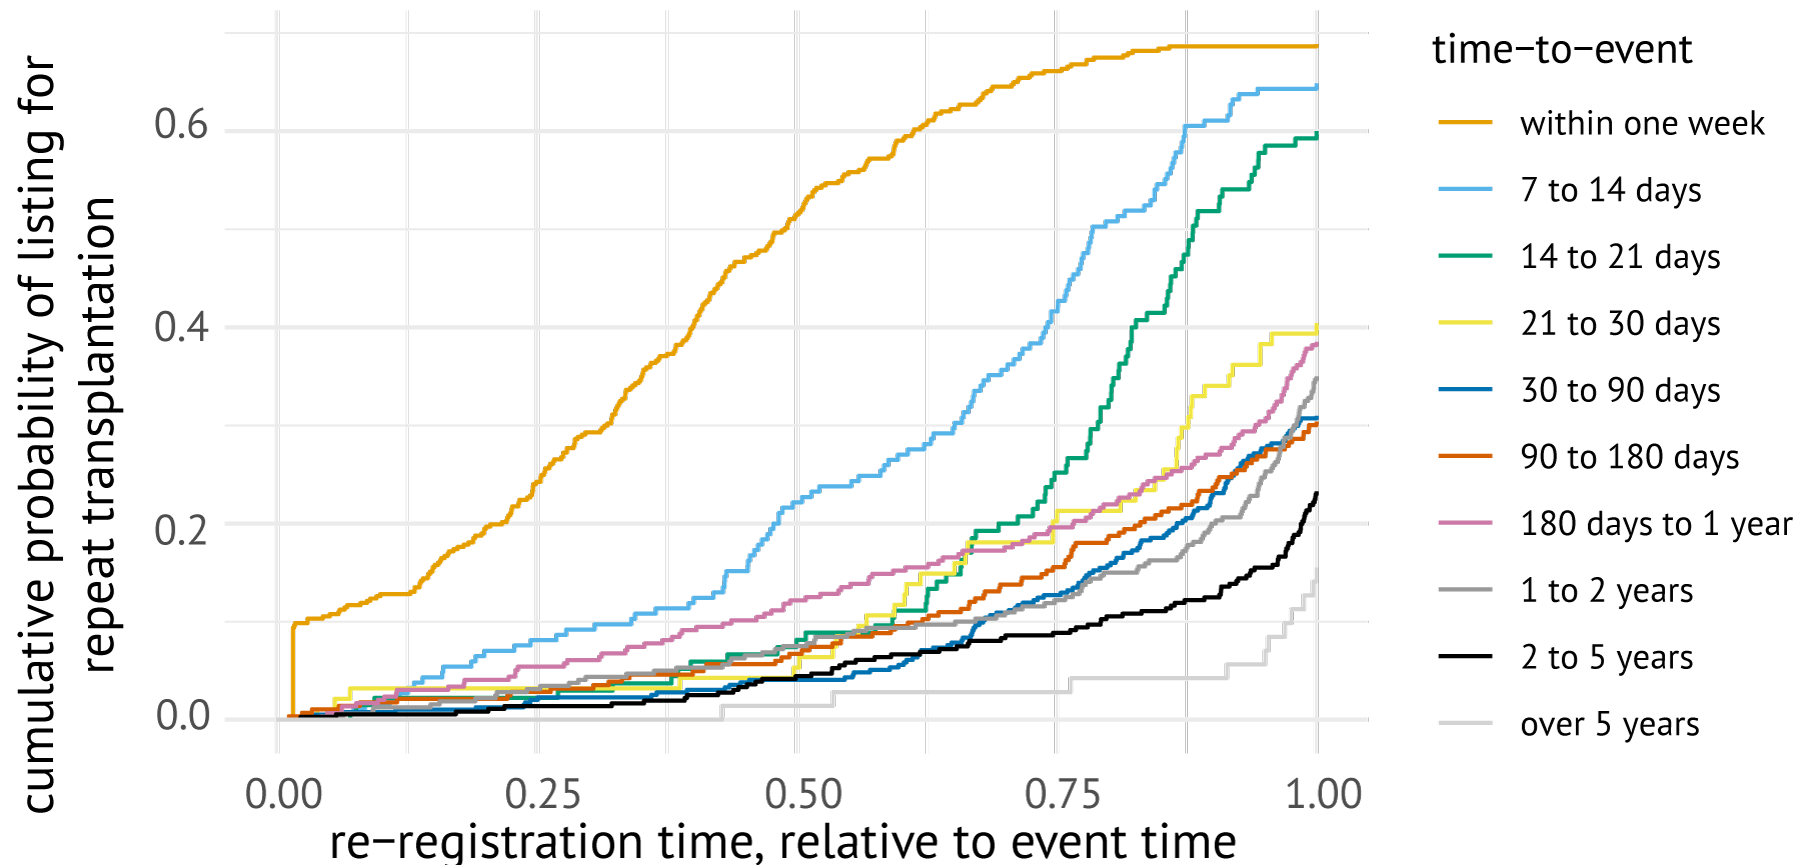
Figure 5.3: Cumulative incidence curves showing the probability of listing for repeat transplantation, stratified by time-to-event categories. These curves were estimated with the Kaplan-Meier estimator based on candidates transplanted between January 1, 2012 and December 31, 2019.
5.4.5.3 Construction of synthetic re-registrations
If a candidate is re-activated on the waiting list before the simulation end date, i.e., \(r\) < \(t\), the post-transplant module adds a synthetic repeat listing to the waiting list. This synthetic listing is generated by combining the fixed patient characteristics of the transplant recipient with the dynamic status updates of a candidate who was actually re-listed for transplantation. This re-listing is chosen such that the candidates (a) have similar time-to-failure \(t\) and similar time-to-relisting \(r\), and (b) match on a pre-specified set of characteristics.
By default, the post-transplant module finds a matching re-registration \(k\) by:
Considering re-listings where candidates match in terms of whether they were re-listed within 14 days9 after transplantation, were listed in the same country, are similarly aged (<20 years difference), and have a similar time-to-relisting and time-to-event (both <1 year difference),
Selecting from these potential re-listings the m=5 listings for repeat transplantation with the closest Mahalanobis distance between (\(r_i\), \(t_i\)) and (\(r_k\), \(t_k\)), and
Sampling one re-listing at random from these \(m\) re-listings.
A synthetic re-listing is then constructed by combining the patient attributes from transplant recipient \(i\) with status updates from patient \(k\). The post-transplant module does not copy profile status updates from \(k\) to \(i\), as these allocation profiles are considered patient-specific. Exception scores from \(k\) are copied only if both patients were listed in the same country, since certain (N)SEs are associated with listing for repeat transplantation (e.g., hepatic artery thrombosis).
5.5 Verification and validation
The previous section described the design of the ELAS simulator and its modules. In this section, we describe our efforts to ensure that the ELAS simulator adequately represents ELAS. For this, we distinguish between model verification, which refers to efforts taken to identify coding errors in the software, and model validation, which refers to efforts taken to assess whether simulated outcomes closely approximate actual outcomes of Eurotransplant liver allocation. For a general discussion of model verification and model validation, we refer to Carson [99].
5.5.1 Verification
The 2016 functional specifications for ELAS were consulted to implement the liver allocation rules. The correctness of our implementation was verified by exporting ELAS match lists for 500 donors reported between January 1, 2016 and December 31, 2019, and testing whether match codes were correctly constructed and whether We constructed unit tests to verify that the ELAS simulator correctly generated the match codes for these lists based on the reported donor and candidate information. We also constructed unit tests to ascertain that the simulator returned candidates in exactly the same order as the exported match lists. To ensure the correctness of the exception module, we exported (N)SE exception score definitions directly from the Eurotransplant database. For the obligation system module, we used the functional specifications of the ELAS obligation system to guide our implementation. These functional specifications contain examples of how obligations have to be linked, including how to date the obligations that arise from multiple linkable obligations. We implemented these examples as unit tests for the ELAS simulator.
5.5.2 Validation
Discrete-event simulators for organ allocation are typically validated by comparing simulated statistics over a set time window to the actual statistics from the same time period [86], [94]. Properties commonly validated are the number of transplantations and waiting list deaths, typically also stratified by patient groups. We follow this practice to validate the ELAS simulator. We do not use traditional hypothesis testing (or confidence intervals) to compare simulated and actual statistics, as “traditional hypothesis testing is not appropriate for measuring model validity because the null hypothesis that the true system and model are identical is almost always false” [94]. In fact, any difference between actually observed outcomes and simulations can be made significant by increasing the number of simulation runs. Instead, we give insight into the variability of ELAS simulator outputs by reporting 95% interquantile ranges (95% IQRs) for simulation runs. These interquantile ranges are obtained by simulating liver allocation 200 times, and reporting the 2.5th and 97.5th percentiles for simulated outcomes of interest. When the real summary statistic for an outcome of interest falls within the 95% interquantile range, we say that the ELAS simulator is “well-calibrated” for this outcome.
For input-output validation, we simulate Eurotransplant liver allocation 200 times between January 1, 2016, and December 31, 2019. The donor input stream consists of all 6,417 donors that were reported in this simulation window whose livers were transplanted after allocation through ELAS. Characteristics of these donors are shown in Table 5.2. The candidate input stream consists of all patients who had an active waiting list status in the simulation period. These consist of n=7,137 patients who were activated on the waiting list in the simulation window (see Table 5.3), and n=1,831 patients waiting on January 1, 2016 (see Table 5.4).
| variable | level |
Austria (n=610) |
Belgium (n=1160) |
Croatia (n=514) |
Germany (n=2927) |
Hungary (n=406) |
Netherlands (n=672) |
Slovenia (n=128) |
|---|---|---|---|---|---|---|---|---|
| (N=610) | (N=1160) | (N=514) | (N=2927) | (N=406) | (N=672) | (N=128) | ||
| sex | female |
292 (48%) |
496 (43%) |
241 (47%) |
1375 (47%) |
180 (44%) |
327 (49%) |
53 (41%) |
| male |
318 (52%) |
664 (57%) |
273 (53%) |
1552 (53%) |
226 (56%) |
345 (51%) |
75 (59%) |
|
| age (years) |
mean [Q1-Q3] |
51 [41-63] |
52 [40-65] |
58 [49-71] |
52 [41-66] |
46 [36-59] |
50 [42-61] |
55 [44-70] |
| type | HB |
604 (99%) |
854 (74%) |
514 (100%) |
2927 (100%) |
406 (100%) |
425 (63%) |
128 (100%) |
| NHB |
6 (1%) |
306 (26%) |
– | – | – |
247 (37%) |
– | |
| death cause | anoxia |
69 (11%) |
312 (27%) |
22 (4%) |
482 (16%) |
32 (8%) |
126 (19%) |
9 (7%) |
| CVA |
398 (65%) |
515 (44%) |
401 (78%) |
1772 (60%) |
291 (72%) |
372 (55%) |
60 (47%) |
|
| trauma |
130 (21%) |
272 (23%) |
84 (16%) |
533 (18%) |
76 (19%) |
146 (22%) |
54 (42%) |
|
| other |
13 (2%) |
61 (5%) |
7 (1%) |
140 (5%) |
7 (2%) |
28 (4%) |
5 (4%) |
|
| marginal | no |
553 (91%) |
1062 (92%) |
436 (85%) |
2566 (88%) |
379 (93%) |
628 (94%) |
108 (84%) |
| yes |
57 (9%) |
98 (8%) |
78 (15%) |
361 (12%) |
27 (7%) |
44 (6%) |
20 (16%) |
|
| ET-DRI |
mean [Q1-Q3] |
1.44 [1.2-1.7] |
1.61 [1.2-1.9] |
1.56 [1.3-1.8] |
1.46 [1.2-1.7] |
1.41 [1.1-1.6] |
1.62 [1.4-1.9] |
1.46 [1.2-1.7] |
| CVA, cerebrovascular accident; HB, heartbeating; NHB, nonheartbeating; ET-DRI, ET donor risk index. |
| variable | level |
Austria (n=663) |
Belgium (n=1128) |
Croatia (n=558) |
Germany (n=3682) |
Hungary (n=315) |
Netherlands (n=685) |
Slovenia (n=106) |
|---|---|---|---|---|---|---|---|---|
| (N=663) | (N=1128) | (N=558) | (N=3682) | (N=315) | (N=685) | (N=106) | ||
| status at listing | active |
622 (94%) |
1053 (93%) |
509 (91%) |
3028 (82%) |
299 (95%) |
576 (84%) |
105 (99%) |
| inactive |
41 (6%) |
75 (7%) |
49 (9%) |
654 (18%) |
16 (5%) |
109 (16%) |
1 (1%) |
|
| sex | female |
163 (25%) |
354 (31%) |
152 (27%) |
1320 (36%) |
135 (43%) |
257 (38%) |
40 (38%) |
| male |
500 (75%) |
774 (69%) |
406 (73%) |
2362 (64%) |
180 (57%) |
428 (62%) |
66 (62%) |
|
| listing age (years) |
mean [Q1-Q3] |
55 [51-64] |
55 [49-65] |
57 [53-65] |
50 [45-62] |
48 [36-61] |
51 [44-63] |
54 [51-63] |
| disease group | (S)ALF |
47 (7%) |
96 (8%) |
33 (6%) |
511 (14%) |
13 (4%) |
97 (14%) |
7 (7%) |
| cholestatic |
62 (9%) |
105 (9%) |
70 (12%) |
560 (15%) |
78 (25%) |
156 (23%) |
20 (19%) |
|
| cirrhosis |
301 (45%) |
432 (38%) |
236 (42%) |
1432 (39%) |
147 (47%) |
165 (24%) |
57 (54%) |
|
| HCC |
193 (29%) |
342 (30%) |
148 (26%) |
719 (20%) |
29 (9%) |
180 (26%) |
15 (14%) |
|
| other |
60 (9%) |
153 (14%) |
71 (13%) |
460 (12%) |
48 (15%) |
87 (13%) |
7 (7%) |
|
| HU status | yes |
76 (12%) |
131 (12%) |
42 (8%) |
654 (18%) |
26 (8%) |
110 (16%) |
13 (12%) |
| no |
587 (88%) |
997 (88%) |
516 (92%) |
3028 (82%) |
289 (92%) |
575 (84%) |
93 (88%) |
|
| lab-MELD at listing |
mean [Q1-Q3] |
17 [11-22] |
18 [10-23] |
17 [11-21] |
20 [12-28] |
15 [10-17] |
18 [10-23] |
18 [12-23] |
| (N)SE at listing | yes |
69 (10%) |
439 (39%) |
186 (33%) |
866 (24%) |
– |
66 (10%) |
– |
| no |
594 (90%) |
689 (61%) |
372 (67%) |
2816 (76%) |
315 (100%) |
619 (90%) |
106 (100%) |
|
| (S)ALF, (Sub-)Acute Liver Failure; HCC, hepatocellular carcinoma; (N)SE, (non-)standard exception. |
| variable | level |
Austria (n=64) |
Belgium (n=172) |
Croatia (n=57) |
Germany (n=1276) |
Hungary (n=121) |
Netherlands (n=124) |
Slovenia (n=17) |
|---|---|---|---|---|---|---|---|---|
| (N=64) | (N=172) | (N=57) | (N=1276) | (N=121) | (N=124) | (N=17) | ||
| status (Jan 1, 2016) | active |
47 (73%) |
143 (83%) |
32 (56%) |
790 (62%) |
101 (84%) |
86 (69%) |
14 (82%) |
| inactive |
17 (27%) |
29 (17%) |
25 (44%) |
486 (38%) |
20 (16%) |
38 (31%) |
3 (18%) |
|
| sex | female |
20 (31%) |
62 (36%) |
21 (37%) |
447 (35%) |
68 (56%) |
40 (32%) |
5 (29%) |
| male |
44 (69%) |
110 (64%) |
36 (63%) |
829 (65%) |
53 (44%) |
84 (68%) |
12 (71%) |
|
| listing age (years) |
mean [Q1-Q3] |
53 [50-63] |
54 [46-65] |
52 [45-61] |
49 [43-59] |
49 [40-60] |
48 [38-61] |
52 [45-63] |
| disease group | (S)ALF |
2 (3%) |
2 (1%) |
0 (0%) |
25 (2%) |
0 (0%) |
1 (1%) |
0 (0%) |
| cholestatic |
7 (11%) |
28 (16%) |
6 (10%) |
219 (17%) |
37 (31%) |
32 (26%) |
5 (29%) |
|
| cirrhosis |
37 (58%) |
61 (36%) |
46 (81%) |
712 (56%) |
60 (50%) |
34 (27%) |
8 (47%) |
|
| HCC |
12 (19%) |
46 (27%) |
1 (2%) |
174 (14%) |
15 (12%) |
35 (28%) |
2 (12%) |
|
| other |
6 (9%) |
35 (20%) |
4 (7%) |
146 (11%) |
9 (7%) |
22 (18%) |
2 (12%) |
|
| HU status | yes |
0 (0%) |
2 (1%) |
0 (0%) |
12 (1%) |
0 (0%) |
0 (0%) |
0 (0%) |
| no |
64 (100%) |
170 (99%) |
57 (100%) |
1264 (99%) |
121 (100%) |
124 (100%) |
17 (100%) |
|
| lab-MELD (Jan 1, 2016) |
mean [Q1-Q3] |
15 [11-18] |
14 [9-18] |
12 [9-14] |
13 [9-16] |
13 [9-15] |
12 [8-14] |
13 [11-14] |
| (N)SE (Jan 1, 2016) | no |
64 (100%) |
84 (49%) |
56 (98%) |
1066 (84%) |
121 (100%) |
102 (82%) |
17 (100%) |
| yes | — |
88 (51%) |
1 (2%) |
210 (16%) |
— |
22 (18%) |
— | |
| (S)ALF, (Sub-)Acute Liver Failure; HCC, hepatocellular carcinoma; (N)SE, (non-)standard exception. |
These counts do not include candidates who were transplanted with a living donor as ELAS is only used to allocate deceased-donor livers. We also excluded candidates whose country of listing changed (29 listings in total). For simulation, we use actual donor arrival times and actual candidate status histories, which were completed with the status completion procedure described in Appendix B. For each of the 200 simulation runs, a different file of completed candidate status updates is used. These files differ in the completed status update trajectories per candidate.
Table 5.5 shows the validation results for waiting list outcomes. This table shows that the ELAS simulator is well-calibrated for the number of split liver transplantations, the number of total listings and those for a repeat transplantation, the number of waiting list removals, and the number of waiting list deaths. A statistic for which the simulator is not well-calibrated is the active waiting list size at simulation termination, which is 4.5% larger in simulations than in reality. The ELAS simulator is well-calibrated for the number of waiting list deaths per country, except for in Germany where the number of waiting list deaths is underestimated by 52 deaths (-8.1%), on average, over the 200 simulations. Inspecting waiting list deaths by groupings of the lab-MELD score shows that the ELAS simulator underestimates the number of waiting list deaths in candidates with the highest MELD scores (-8.1% for MELD 31–40) and HU / ACO candidates (-27.2%), while the simulator overestimates the number of waiting list deaths in candidates with low MELD scores (+11.8% for MELD 6–10).
|
simulated results (average and 95% IQR) |
actual (2016-2019) |
|
|---|---|---|
| deceased-donor livers | ||
| total transplantations | 6,415 [6,398-6,432] | 6,418 |
| grafts discarded | 3 [1-5] | |
| number of livers split | 173 [156-192] | 181 |
| split transplantations | 346 [311-383] | 354 |
| waiting list | ||
| patient listings | 12,086 [12,034-12,141] | 12,110 |
| relisting (synthetic) | 650 [598-705] | 652 |
| final active waiting list | 1,528 [1,485-1,571] | 1,462 |
| removals (excl. recoveries) | 860 [831-1,888] | 857 |
| deaths | 1,636 [1,582-1,690] | 1,686 |
| waiting list mortality by country | ||
| Austria | 85 [72-100] | 82 |
| Belgium | 169 [148-190] | 165 |
| Croatia | 109 [97-121] | 98 |
| Germany | 1,096 [1,051-1,140] | 1,148 |
| Hungary | 62 [52-72] | 72 |
| Netherlands | 93 [79-107] | 101 |
| Slovenia | 22 [17-29] | 20 |
| waiting list mortality by urgency | ||
| lab-MELD 6-10 deaths | 123 [113-134] | 110 |
| lab-MELD 11-20 deaths | 498 [473-524] | 482 |
| lab-MELD 21-30 deaths | 387 [361-413] | 379 |
| lab-MELD 31-40 deaths | 505 [467-542] | 546 |
| hU / ACO deaths | 123 [103-142] | 169 |
Table 5.6 shows validation results relating to transplantations, separately for standard and non-standard allocation. The ELAS simulator is well-calibrated for most summary statistics, including the number of placements through each allocation mechanism, as well as the number of transplantations stratified by pediatric status and candidate sex. The simulator is not well-calibrated for the number of transplantations within all Eurotransplant countries. In total, 55 too many transplantations (\(+4.2\%\)) are performed in the simulations in Belgium, while on average 35 (-5.6%) and 15 (-3.0%) too few transplantations are simulated in Austria and Croatia, respectively. Restricting attention to standard allocation, we find that too few grafts are accepted in Austria (-6.8%), Croatia (-6.0%) and Hungary (-7.4%). Generally, too few grafts are accepted locally or regionally in simulations (-15%).
|
simulated results (average and 95% IQR) |
actual (2016-2019) |
simulated results (average and 95% IQR) |
actual (2016-2019) |
|
|---|---|---|---|---|
| allocation mechanism | ||||
| HU or ACO | 942 [905-977] | 931 | 935 [899-968] | 927 |
| obligation | 325 [302-354] | 290 | 325 [302-354] | 290 |
| MELD-based | 3850 [3636-4052] | 4005 | 3850 [3636-4052] | 4005 |
| extended or rescue | 1298 [1099-1503] | 1192 | ‑ | ‑ |
| recipient characteristics | ||||
| female | 2142 [2107-2186] | 2140 | 1764 [1690-1829] | 1825 |
| male | 4273 [4227-4310] | 4278 | 3346 [3196-3484] | 3397 |
| pediatric recipient | 418 [396-439] | 424 | 397 [372-417] | 405 |
| match geography | ||||
| local or regional | 2506 [2398-2600] | 2523 | 1577 [1496-1668] | 1850 |
| national | 2664 [2543-2779] | 2647 | 2430 [2267-2581] | 2298 |
| international | 1245 [1183-1300] | 1248 | 1104 [1049-1155] | 1074 |
| Austria | 585 [561-605] | 620 | 534 [508-563] | 573 |
| Belgium | 1122 [1098-1142] | 1067 | 997 [937-1040] | 983 |
| Croatia | 481 [466-493] | 496 | 456 [437-470] | 485 |
| Germany | 3178 [3148-3208] | 3166 | 2161 [1993-2323] | 2165 |
| Hungary | 298 [284-312] | 312 | 287 [270-301] | 310 |
| Netherlands | 656 [626-681] | 656 | 583 [527-618] | 607 |
| Slovenia | 96 [88-103] | 101 | 92 [83-100] | 99 |
| MELD type (non-HU / ACO only) | ||||
| lab-MELD only | 3250 [3195-3299] | 3289 | 2453 [2327-2567] | 2482 |
| HCC | 1190 [1158-1221] | 1150 | 903 [848-962] | 917 |
| NSE | 259 [239-275] | 286 | 205 [179-224] | 248 |
| other SE | 558 [533-579] | 547 | 421 [388-453] | 453 |
| match-MELD (adult non-HU / ACO only) | ||||
| match-MELD 6–10 | 434 [400-476] | 493 | 337 [304-368] | 360 |
| match-MELD 11–20 | 1388 [1294-1487] | 1466 | 970 [913-1021] | 982 |
| match-MELD 21–30 | 2482 [2386-2574] | 2285 | 1792 [1633-1933] | 1769 |
| match-MELD 31–40 | 952 [899-1000] | 1025 | 884 [826-935] | 989 |
| unknown | – | 3 | ||
| lab-MELD (adult non-HU / ACO only) | ||||
| lab-MELD 6–10 | 1292 [1254-1337] | 1373 | 974 [910-1028] | 1066 |
| lab-MELD 11–20 | 2143 [2058-2226] | 2181 | 1535 [1458-1605] | 1553 |
| lab-MELD 21–30 | 1044 [993-1093] | 942 | 752 [675-816] | 739 |
| lab-MELD 31–40 | 778 [731-828] | 769 | 721 [669-780] | 738 |
| unknown | – | 7 | 0 | 4 |
Regarding transplantations categorized by type of exception, we find that the ELAS simulator is well-calibrated for the number of transplantations in non-exception candidates and in candidates with SE other than HCC. The total number of transplantations with HCC is overestimated by 40 on average (+3.5%), but is well-calibrated if attention is restricted to standard allocation. The simulator underestimates the number of transplantations in candidates with NSEs, both in standard allocation (-17.5%) and in total (-9.5%).
In terms of the number of transplantations per MELD score via standard allocation, the ELAS simulator appears to be mostly well-calibrated, with only the number of transplantations in candidates with lab-MELD scores between 6 and 10 underestimated (-8.6%) and those in candidates with match-MELD between 31 and 40 overestimated (+11.8%). Additional differences emerge when we also include transplantations which followed non-standard allocation: the ELAS simulator then generally underestimates the number of transplantations in candidates with low MELD scores (MELD: 6–10) and overestimates the number of transplantations in those with high MELD scores (MELD: 21–30 and 31–40).
5.5.2.1 Validation of post-transplant outcomes
Figure 5.4 compares the simulated post-transplant event rates with the actual post-transplant event rates, estimated per country at several time horizons. These \(t\)-day post-transplant survival probabilities were estimated with the Kaplan-Meier estimator. The simulated event rates are close to the actual event rates in all Eurotransplant regions. Only in Croatia and Slovenia, the simulated post-transplant event rates appear to be slightly biased downwards. Figure 5.5 shows that the estimated re-listing probabilities are also comparable to the observed re-listing probabilities.
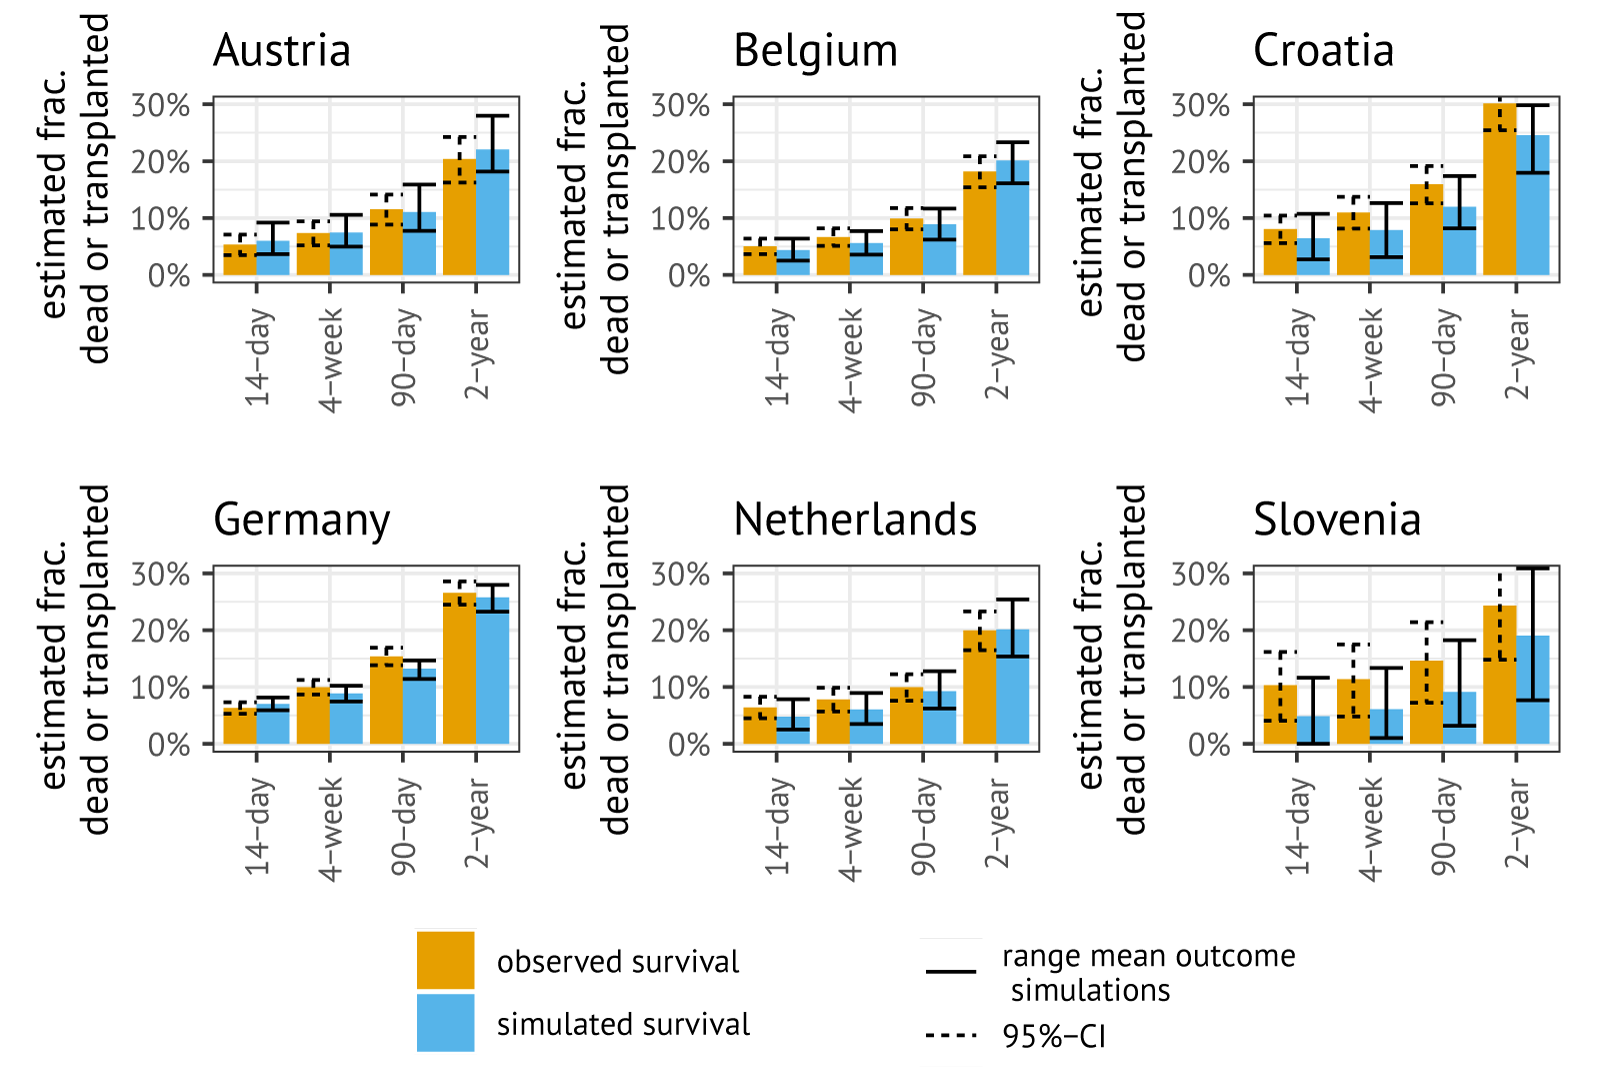
Figure 5.4: The estimated event probabilities for transplant recipients, per country for different time horizons. An event was defined as re-transplantation or waiting list death, whichever occurred first.
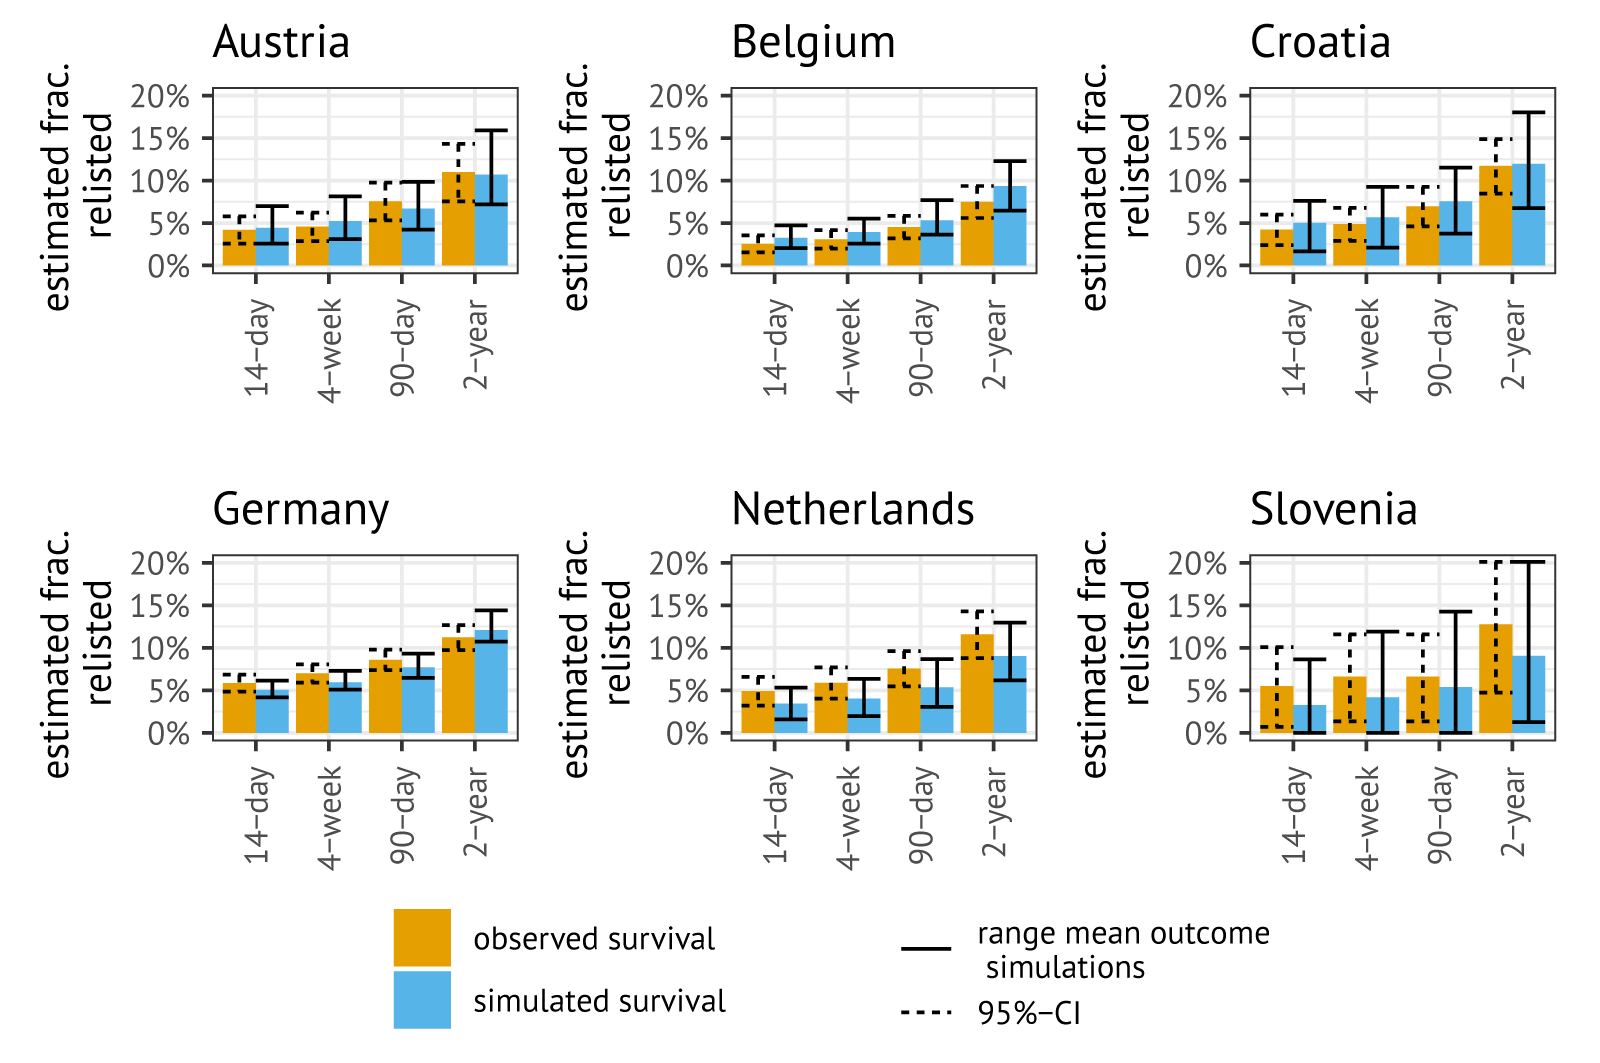
Figure 5.5: Estimated re-listing rates for transplant recipients, per country for different time horizons.
5.5.2.2 Discussion of validation results
The ELAS simulator appears to be well-calibrated for most waiting list and transplantation patterns within Eurotransplant. An important exception is the total number of transplantations and waiting list exits by lab- and match-MELD score. For example, the simulator overestimates the total number of transplantations among candidates with high urgency (MELD 31–40 or HU/ACO status), and underestimates the number of waiting list deaths in this group (see Tables 5.5 and 5.6). Table 5.6 shows that such miscalibration is present to a much lesser degree in standard allocation, with the number of transplantations only slightly overestimated for candidates with the highest match-MELD scores (31-40) and the lowest lab-MELD scores (6-10).
A potential explanation for this miscalibration is that the simulator assumes that candidates who accept a liver graft offer are always transplanted. In practice, however, transplant centers can cancel transplantation procedures after an initial acceptance, for example because of logistical issues, unfavorable histopathology findings, or instability of the transplant candidate. In such cases, Eurotransplant can re-offer the graft to candidates who are located in the vicinity of the graft via extended or rescue allocation. This generally results in the placement of livers in candidates with lower urgency, particularly in the case of rescue allocation, which operates on a first-come, first-serve basis. We note that such rescue allocation was not implemented for the ELAS simulator.
To assess whether competitive rescue allocation could partially explain the observed miscalibration, we inspected the placements of the 241 liver grafts procured from donors in the simulation period that were initially accepted by one candidate, declined before transplantation, and then re-offered to other candidates via competitive rescue allocation. For these 241 livers, Table 5.7 shows the MELD scores of the initially accepting candidate and final transplant recipient. In general, re-offering via rescue allocation indeed leads to lower MELD scores at transplantation, providing a partial explanation for the miscalibration in low-MELD groups in Table 5.5 and 5.6.
A second outcome on which the simulator is not well-calibrated is the number of transplantations per country. For example, in Belgium there are on average 55 (+4%) more transplantations in simulations than in reality. This may also be explained by the lack of competitive rescue allocation, through which approximately 10–15 grafts are transferred per year from Belgium to Germany. The fact that too many grafts are transplanted in Belgium may also explain why the number of transplantations in candidates with HCC is overestimated (see Table 5.6), as Belgium has the highest proportion of candidates that are listed with HCC. This seems supported by the fact that no miscalibration is observed for the number of transplants within candidates with HCC when restricting to livers allocated via standard allocation only (see Table 5.6).
| score | match-MELD | lab-MELD | match-MELD | lab-MELD |
|---|---|---|---|---|
| HU/ACO | 23 | 0 | 0 | 0 |
| MELD 31-40 | 60 | 54 | 1 | 0 |
| MELD 21-30 | 107 | 60 | 53 | 31 |
| MELD 11-20 | 45 | 86 | 140 | 157 |
| MELD 6-10 | 6 | 41 | 47 | 53 |
We thus have two potential explanations for miscalibration of the ELAS simulator, which are (i) the simulator does not allow planned transplantation procedures to be cancelled after an initial acceptance, and (ii) the simulator does not implement competitive rescue allocation. We have chosen not to implement these two mechanisms in the ELAS simulator because (i) the focus of policy discussions in ELIAC is standard allocation, not competitive rescue allocation, (ii) cancellations after an initial acceptance are relatively rare (about 4% of transplantations), and (iii) the decision to proceed with rescue allocation is made on a case-by-case basis, which is difficult to model correctly because of the limited availability of structured data on rescue allocation. In our view, the simulated outcomes are sufficiently close to observed outcomes to make the ELAS simulator useful for policy evaluation. We illustrate this in Section 5.6 with two case studies.
5.6 Case studies: the impact of modifying ELAS rules
With two case studies, we illustrate that the ELAS simulator can be used for quantifying the impact of liver allocation policy changes. For the first case study (Section 5.6.1), we collaborated with representatives from the Belgian Liver and Intestine Advisory committee (BeLIAC) to study the impact of changes to the Belgian exception score system. In the second case study (Section 5.6.2), we study the impact of basing Eurotransplant liver allocation on ReMELD-Na scores instead of UNOS-MELD scores, which was a topic on the agenda of ELIAC in 2023.
To evaluate these ELAS policy changes, we simulate Eurotransplant liver allocation 50 times between January 1, 2016, and December 31, 2019, and compare the outcomes simulated under the modified ELAS rules to the outcomes simulated under the current ELAS rules. We test whether modified policies lead to significantly different outcomes with traditional hypothesis testing. To increase the power of these tests, we use common random number generators [100] to eliminate any variance that is attributable to factors which we assume to be independent from the allocation policy. Specifically, we use common random numbers to synchronize the splitting of liver grafts, the graft offer acceptance behavior of candidates, and the triggering of rescue allocation across policies for each of the 50 replications. By synchronizing these processes across policies, pairwise t-tests can be used to establish the statistical significance of the impact of policy changes.
5.6.1 Case study 1: the exception score system in Belgium
Nearly half of the liver transplant candidates that are listed in Belgium receive exception points, which makes Belgium the country with relatively most awarded (N)SEs in Eurotransplant. Most of these (N)SEs increase with every 90 days of waiting time, which increases the match-MELD score that elective candidates require in Belgium to be offered a liver graft. This has led to concerns that candidates without exception points are crowded out of transplantation.
To address this, the BeLIAC has considered imposing a cap on (N)SE-MELDs of 30, which corresponds to maximizing the awardable 90-day mortality equivalent with a 50% mortality equivalent. In joint discussions, the BeLIAC also expressed an interest in capping (N)SE-MELDs at 25, as well as alternative policy options. These alternatives were slowing down (N)SE-MELDs by reducing the 90-day increments (referred to as “slower” policies), and lowering the initial mortality equivalents awarded for (N)SEs (referred to as “lowered” policies). Table 5.8 provides an overview of the policy options discussed within BeLIAC.
At the request of BeLIAC, these policy alternatives were evaluated with the ELAS simulator. Figure 5.6 and Table 5.9 summarize the results, which both focus on livers from DBD donors (DCD donors are center offers in Belgium). Figure 5.6 visualizes the distributions of the simulated (N)SE-MELD scores at DBD transplantation for exception candidates (left), and laboratory MELD scores at DBD transplantation for non-exception candidates (right). The figure shows that capping (N)SE-MELDs at 30 barely affects their distribution at transplantation, while the other policy alternatives reduce the median (N)SE-MELD at transplantation by up to 4 points on the MELD scale (left side). It also shows that lab-MELD scores at DBD transplantation for non-exception candidates become lower when (N)SEs are capped (right side). In fact, the median lab-MELD at DBD transplantation becomes up to 3 MELD points lower with slower and lowered policies, than the median observed under the current allocation rules. These alternative policies thus increase access to transplantation for candidates with lab-MELD scores between 20 and 23, which may be desired as they face a 90-day mortality risk between 10 to 15%.
| policy | initial equivalent | 90-day increment | maximum equivalent |
|---|---|---|---|
| current |
10% (MELD 20) for most (N)SEs, 15% (MELD 22) for HCC |
10% (2-4 MELD points) |
100% |
| capped (25) | ‑ | ‑ |
25%\(^a\) (MELD 25) |
| capped (30) | ‑ | ‑ |
50%\(^a\) (MELD 30) |
| slower | ‑ |
5% (1-2 MELD points) |
‑ |
| slowest | ‑ |
2.5% (1 MELD point) |
‑ |
| lowered | lowered to 8% (MELD 18) for existing (N)SEs with initial equivalents less than 20% | ‑ | ‑ |
| a Set to the initial equivalent if the initial equivalent exceeds the proposed cap. For example, candidates with biliary atresia maintain a 60% mortality equivalent. |
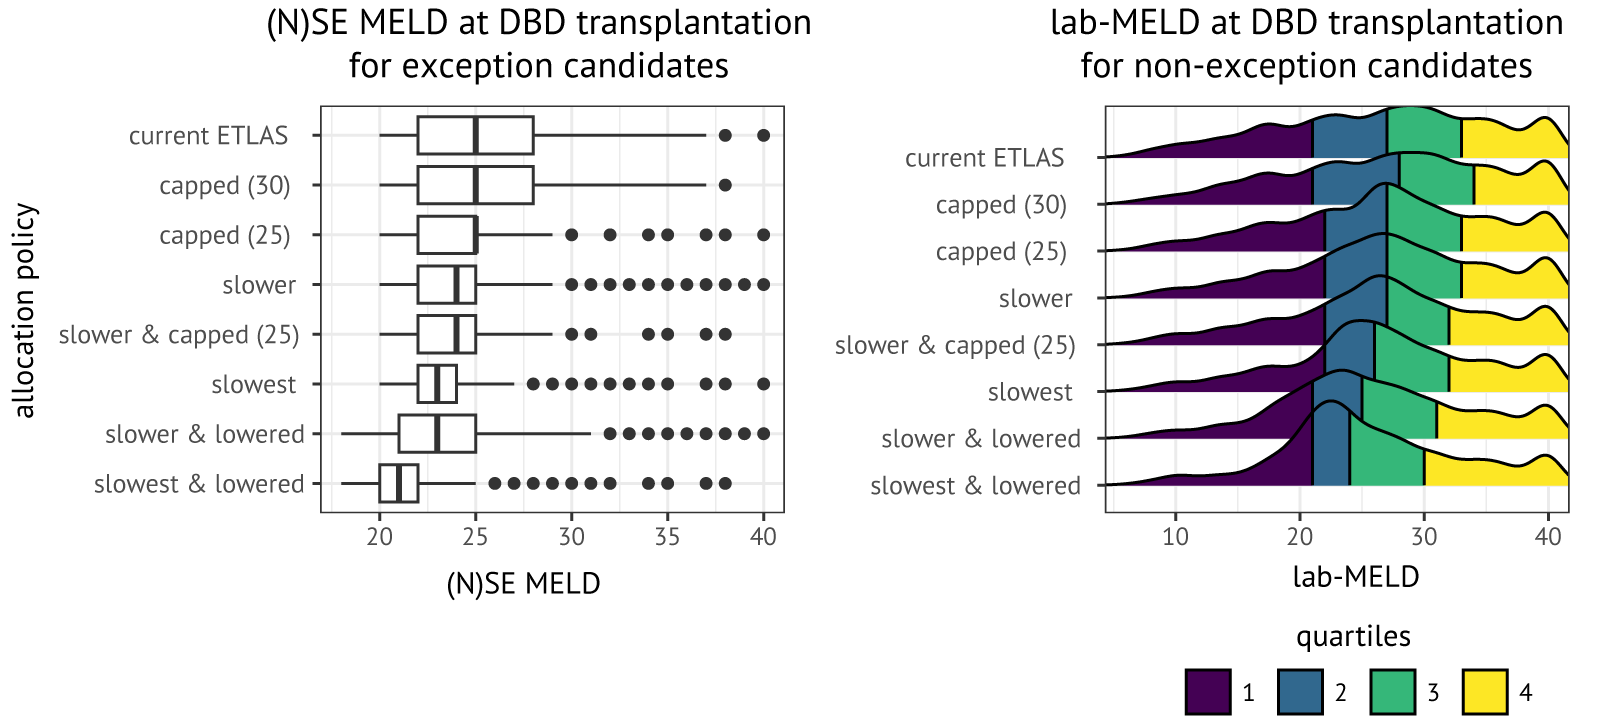
Figure 5.6: Distribution of (N)SE MELD scores at transplantation for exception candidates (left) and laboratory MELD scores at transplantation for non-exception candidates (right) in ELAS simulations. Only transplantations that were the result of patient-driven allocation are shown. Boxplots and distributions were calculated over 50 simulations.
Table 5.9 shows summary statistics for the simulated waiting list outcomes, separately for exception and non-exception candidates. Comparing the third column (actual 2016-2019 statistics) to the fourth column (averages and 95% IQRs over the 50 simulations) shows that the ELAS simulator is well-calibrated for the number of transplantations, waiting list deaths, and waiting list exits. This reassures us that the ELAS simulator reasonably describes these allocation patterns. Of policy interest are the remaining columns of Table 5.9, which show for every (N)SE policy alternative the average number of events over the 50 simulations. Comparing these outcomes to the outcomes simulated under current (N)SE rules shows that almost all policies significantly change the number of transplantations, the number of waiting list deaths, and the number of waiting list removals.
The greatest effects are sorted by combining the slowest and lowered policies (final column), with which on average 20 (+5%) extra candidates without exception points are transplanted. According to the simulation results, this policy could have avoided 12 waiting list deaths in non-exception candidates in Belgium (-10%), which corresponds to 3 waiting list deaths per year. The cost of this policy change is that we see a slight increase in the number of waiting list removals for exception patients, with on average 1–2 extra exception patients per year removed because they became unfit for transplantation, or because they had HCC or another form of cancer.
|
patient type |
policy | transplanted |
waiting list death |
unfit |
removed HCC or Cancer |
|---|---|---|---|---|---|
| (N)SE | Current (real) | 438 | 27 | 20 | 8 |
| Current (sim) | 450 [428-470] | 27 [19-40] | 14 [8-17] | 8 [5-16] | |
| Capped (30) | 445 | 28 | 14 | 9 | |
| Capped 25 | 448 | 27 | 14* | 10** | |
| Slower | 443*** | 28 | 14** | 10** | |
| Slower & capped (25) | 445* | 29 | 14* | 11*** | |
| Slowest | 440*** | 29* | 15*** | 11*** | |
| Slowest & capped (25) | 438*** | 29 | 16*** | 11*** | |
| Slower & lowered | 433*** | 29* | 17*** | 13*** | |
| None | Current (real) | 387 | 119 | 23 | 6 |
| Current (sim) | 405 [379-423] | 126 [108-141] | 21 [16-29] | 6 [2-14] | |
| Capped (30) | 406* | 126 | 21 | 6 | |
| Capped 25 | 408** | 122** | 20 | 6 | |
| Slower | 412*** | 122* | 21 | 6 | |
| Slower & capped (25) | 409*** | 122** | 20 | 6 | |
| Slowest | 413*** | 117*** | 20 | 6 | |
| Slowest & capped (25) | 420*** | 116*** | 20 | 6 | |
| Slower & lowered | 425*** | 114*** | 20* | 6 | |
| ∗ p < 0.05, ∗∗ p < 0.01, ∗∗∗ p < 0.001 |
5.6.2 Case study 2: basing Eurotransplant liver allocation on ReMELD-Na
Candidates with hyponatremia, i.e. low serum sodium levels, face systematically higher waiting list mortality rates than suggested by their MELD score [37]. To adequately prioritize these patients, MELD-Na was introduced in 2016 for liver allocation in the United States. In 2020, Goudsmit et aFl. revised this MELD-Na score with retrospective data from Eurotransplant, leading to the ReMELD-Na score.
In May 2023, the ELIAC recommended basing Eurotransplant liver allocation on ReMELD-Na instead of UNOS-MELD. A matter of concern for ELIAC was that ReMELD-Na scores range from 1 to 36, while UNOS-MELD scores range from 6 to 40. Basing laboratory MELD scores on ReMELD-Na without updating the MELD-curve could therefore mean that non-exception candidates – who depend on lab-MELD for access to transplantation – could only receive match-MELD scores up to 36, while candidates with (N)SE or PED-MELD scores could still receive match-MELD scores up to 40. A switch to ReMELD-Na could thereby inadvertently give extra priority to candidates with exception points, who already appear to have an advantage in ELAS [54].
To support this discussion, we simulated two scenarios for liver allocation using ReMELD-Na. For both scenarios, lab-MELD scores were based on ReMELD-Na, calculated using:
\[ \begin{aligned} \text{ReMELD-Na} &= 7.85 + 9.03\ln(\text{crea}) + 2.97\ln(\text{bili}) + 9.52\ln(\text{INR}) + \\ & 0.392(138.6 - \text{Na}) - 0.351(138.6 - \text{Na})\ln(\text{crea}). \end{aligned} \]
In the first scenario, the exception score system remained unchanged, which means that PED-MELD and (N)SE-MELD scores are calculated based on the UNOS-MELD survival curve. This curve is given by the following formula:
\[ S_{90}^{\texttt{UNOS-MELD}} = 0.98037^{0.17557(\texttt{UNOS-MELD} - 10)}. \]
In the second scenario, PED-MELD and (N)SE-MELD scores are instead calculated based on a survival curve developed specifically for ReMELD-Na. This curve was obtained by estimating a Cox proportional hazards model on Eurotransplant registry data using ReMELD-Na as the only covariate. The obtained ReMELD-Na curve is given by the following formula:
\[ S_{90}^{\text{ReMELD-Na}} = 0.9745^{0.2216(\text{ReMELD-Na} - 10)}. \]
Table 5.10 shows simulated waiting list outcomes under these ReMELD-Na policies, summarized over 50 simulations. The third column shows that introducing ReMELD-Na without updating the S-curve results in approximately 70 extra waiting list deaths in total (p < 0.001), which corresponds to 15–20 extra waiting list deaths per year. This finding is likely explained by ELIAC’s concern that a switch to ReMELD-Na inadvertently deprioritizes candidates who depend on lab-MELD scores for access to transplantation. The fourth column shows that switching to ReMELD-Na with the updated S-curve could have averted 25 waiting list deaths in total (p < 0.001).
| exit reason | UNOS-MELD (current) |
ReMELD-Na (old S-curve) |
ReMELD-Na (updated S-curve) |
|---|---|---|---|
| waiting list deaths | 1633 [1581-1685] | 1703*** [1643-1763] | 1608*** [1546-1669] |
| transplantations | 6414 [6400-6428] | 6417* [6401-6433] | 6410*** [6396-6423] |
| removed | 859 [834-885] | 837*** [812-862] | 870*** [842-898] |
| ∗ p < 0.05, ∗∗ p < 0.01, ∗∗∗ p < 0.001 |
An important limitation of this analysis is that serum sodium measurements are not available for most candidates in Eurotransplant registry data. When serum sodium was missing in simulations, we calculated ReMELD-Na scores with a serum sodium level of 138.6 mmol/l, which results in 0 points being awarded for hyponatremia. Because this means that hyponatremia could not be prioritized in all candidates, the reduction of 25 waiting list deaths is a conservative projection.
Whether serum sodium is reported to Eurotransplant depends primarily on the candidate’s listing center, because the transplant centers either never or almost always report serum sodium to Eurotransplant. This motivated us to also assess the number of waiting list deaths stratified by the listing center’s track record of reporting serum sodium. For this, we categorize centers into centers with high, medium and low serum sodium completeness. Table 5.11 shows the total number of waiting list deaths per type of center. It can be seen that the reduction in waiting list deaths is indeed concentrated in centers with high serum sodium completeness, with 28 fewer waiting list deaths observed in such centers. Under the (optimistic) assumption that this reduction in waiting list deaths is representative for all centers in Eurotransplant, using ReMELD-Na as the basis for liver allocation could have prevented up to 80 waiting list deaths over the simulation period.
| sodium completeness | centers | patients |
waiting list deaths under UNOS-MELD |
waiting list deaths under ReMELD-Na (updated S-curve) |
|---|---|---|---|---|
| high | 14 | 3995 | 589 [554-623] | 561*** [518-603] |
| medium | 13 | 3098 | 446 [404-489] | 446 [402-491] |
| low | 10 | 4775 | 590 [551-629] | 593 [555-632] |
| ∗ p < 0.05, ∗∗ p < 0.01, ∗∗∗ p < 0.001 |
In discussions with ELIAC and national competent authorities on ReMELD-Na, concerns were raised about the impact of ReMELD-Na on pediatric, adolescent, and female transplant candidates. Table 5.12 shows the simulated impact of ReMELD-Na on these vulnerable patient groups. The switch to ReMELD-Na has little impact on outcomes for these patients, suggesting that the reduction in waiting list deaths is concentrated in males aged 30 years or older.
The table also shows the impact of ReMELD-Na on candidates with renal dysfunction: fewer candidates on biweekly dialysis are transplanted under ReMELD-Na, as are candidates who require a combined liver and kidney transplantation. Such a change could potentially be welcomed, as there are indications in the literature that UNOS-MELD overprioritized candidates with renal dysfunction [40].
| UNOS-MELD | ReMELD-Na | diff. | per year | ||
|---|---|---|---|---|---|
| pediatric cand. (<18 yrs) | transplanted | 220 [205-235] | 209 [196-220] | -11 | -2.8 |
| pediatric cand. (<18 yrs) | deceased | 24 [20-28] | 25 [20-31] | 1 | 0.2 |
| adolescents (18-29 yrs) | transplanted | 232 [216-247] | 219 [206-232] | -13 | -3.3 |
| adolescents (18-29 yrs) | deceased | 25 [21-29] | 27 [21-33] | 2 | 0.5 |
| females | transplanted | 1599 [1562-1637] | 1586 [1557-1614] | -13 | -3.3 |
| females | deceased | 524 [497-551] | 522 [500-544] | -2 | -0.5 |
| liver + kidney candidates | transplanted | 236 [225-246] | 204 [192-217] | -32 | -8.0 |
| liver + kidney candidates | deceased | 57 [50-64] | 68 [59-77] | 11 | 2.8 |
| candidates on dialysis | transplanted | 442 [414-470] | 376 [352-401] | -66 | -16.5 |
| candidates on dialysis | deceased | 257 [237-276] | 275 [253-297] | 18 | 4.5 |
5.7 Conclusions and discussion
To help align the interests and perspectives of its member countries, Eurotransplant requires a tool that can quantify the impact of proposed policy changes to its liver allocation system. Discrete-event simulation is an excellent tool for this purpose, and is already routinely used in other geographic regions to revise organ allocation policies. This chapter reports on the development of the ELAS simulator, which is the first simulator tailored to the unique challenges of Eurotransplant as a multi-national organ exchange organization.
To build trust in the ELAS simulator as a policy evaluation tool, we have validated the ELAS simulator by comparing simulated outcomes to observed outcomes between January 1, 2016, and December 31, 2019. We found that the simulator is able to closely replicate most patterns in Eurotransplant liver allocation. In our own view, and in ELIAC’s, the remaining differences are sufficiently small for the ELAS simulator to contribute to liver allocation policy evaluation within Eurotransplant. We have illustrated this with two case studies. The case study on the Belgian exception point system has been discussed within BeLIAC, and has led to a recommendation to cap (N)SE scores in Belgium at 28. The case study on ReMELD-Na has led to a recommendation to switch to allocation based on ReMELD-Na, which was implemented on March 25, 2025.
Although this demonstrates that the ELAS simulator is useful for policy evaluation, the software also has limitations. A first limitation is that our simulations are driven by Eurotransplant registry data, which does not capture all information relevant for liver allocation development. For example, in the second case study we have seen that serum sodium is not available in Eurotransplant registry data for many candidates, which complicated the assessment of the impact of allocation based on ReMELD-Na. This limitation could be addressed by prospective data collection of factors relevant to allocation. Secondly, the statistical models for graft offer acceptance behavior and post-transplant survival were calibrated to historical data. Developments in liver transplantation threaten the external validity of these models. An example of such a development is machine perfusion, which is enhancing the outcomes after liver transplantation [101] and which is altering the graft offer acceptance behavior of transplant centers. This limitation can potentially be addressed by re-calibrating the statistical models with contemporary data.
From a policy perspective, several areas remain in which Eurotransplant’s liver allocation system may be improved. These areas include taking post-transplant outcomes into account when allocating livers [19], broader geographic sharing of livers for candidates with very high MELD scores [102], [103], and rectifying sex disparity in liver waiting list outcomes [64]. We anticipate that the ELAS simulator can play a role in informing ELIAC of the impact of policy changes related to these topics.
References
http://github.com/hansdeferrante/Eurotransplant_ELAS_simulator↩︎
younger than 18 in all countries since March 2025.↩︎
In fact, only 20% of transplanted livers are accepted by the top-ranked candidate in Eurotransplant.↩︎
This is necessitated by the fact that processing of a status update may result in automatic scheduling of a new update, see Section 5.4.3.↩︎
(N)SEs that require manual re-certification increase immediately after re-certification, which can occur 14 days before expiry (i.e., every 76–90 days). Simulations assume that these (N)SEs upgrade every 80 days in case no re-certification is known for the candidate. (N)SEs and PED-MELD with automatic re-certification increase every 90 days.↩︎
For example, a candidate with biliary sepsis in Germany with a MELD score of 21 would receive a 30 percent point bonus amount. Their lab-MELD score of 21 corresponds to a 90-day mortality equivalent of 26%, giving them in total a 26% + 30% = 56% mortality equivalent, which corresponds to a MELD score of 30.↩︎
This transformation is based on a Cox proportional hazards model which uses MELD as the only predictor, and which uses a MELD score of 10 as the reference group. The curve used by Eurotransplant is given by: \[S_{90} = 0.98037 ^ {\exp\Big(0.17557(\texttt{UNOS-MELD} - 10)\Big)},\] where 0.98037 is the 90-day mortality equivalent for a MELD score of 10, and 0.17557 is the slope on MELD.↩︎
Patients that are re-listed for liver transplantation within 14 days of transplantation can be eligible for an HU status under the current allocation rules [58].↩︎