Chapter 8 The ETKidney simulator
An article based on this chapter has been submitted for publication: de Ferrante, H.C., Laguna-Goya, R., Smeulders, B.M.L., Spieksma, F.C.R., Tieken, I.
Abstract
A barrier to modernizing ETKAS and ESP kidney allocation rules is that Eurotransplant lacks tools to quantitatively assess the impact of kidney allocation policy changes. We present the ETKidney simulator, which was developed for this purpose. This tool simulates kidney allocation according to the actual ETKAS and ESP allocation rules. The ETKidney simulator was developed in close collaboration with medical doctors from Eurotransplant, and was presented to the Eurotransplant Kidney Advisory Committee as well as other major stakeholders. To enhance trust in the tool, the ETKidney simulator has been made publicly available together with synthetic data.
In this chapter, we describe the ETKidney simulator in detail and validate the simulator by comparing simulated outcomes to actual ETKAS and ESP outcomes between April 1, 2021, and December 31, 2024. We illustrate how the simulator can contribute to the evaluation of alternative kidney allocation policies with three clinically motivated case studies. We anticipate that the ETKidney simulator will be pivotal in modernizing ETKAS and ESP allocation rules by enabling informed decision-making on kidney allocation rules in collaboration with national competent authorities.
8.1 Introduction
Potential improvements to ETKAS and ESP are regularly proposed, and are often based on medical insights or ethical considerations. For instance, proposals have been made to emphasize DR matching in ETKAS [130], [156], motivated by findings that mismatches at the HLA-DR locus are most deleterious to graft survival [157], [158]. Other proposals include making candidates under the age of 65 eligible for ESP [159], introducing HLA-DR matching in ESP [145], introducing candidate-donor age matching [150], basing HLA matching on epitope matching [160], and giving extra priority to the candidates who are immunized but do not qualify for the Acceptable Mismatch (AM) program [134], [135].
Within Eurotransplant, such areas for improvement are regularly discussed by the Eurotransplant Kidney Advisory Committee (ETKAC), whose members are nephrologists who represent the Eurotransplant member countries, an abdominal surgeon, and an immunologist. Despite regular ETKAC discussions on the aforementioned topics, ETKAS and ESP have not changed much since their initiations in 1996 and 1999, respectively. To support discussions within ETKAC and discussions with national competent authorities, Eurotransplant requires a tool that can quantify the impact of policy changes in ETKAS and ESP. Computer simulations can be used for this purpose.
The use of computer simulations to design kidney allocation systems is not new. In fact, ETKAS itself was based on computer simulations that were published in in 1993 [126], [161]. Other organ allocation organizations also routinely note the usage of computer simulations. For example, in the United States, the Kidney-Pancreas Simulated Allocation Model (KPSAM) was used to revise allocation rules in 2014 [149], and this tool continues to be used for the proposal of further changes to allocation [162], [163]. The kidney allocation policies in France and the United Kingdom were also updated on the basis of bespoke computer simulations in 2015 and 2019, respectively [147], [164], [165]. A bespoke model for Eurotransplant has not been available.
This motivated us to develop a simulation toolbox that enables Eurotransplant and other stakeholders to quantify the impact of changes to ETKAS and ESP allocation rules. This tool, which we refer to as the ETKidney simulator, uses discrete-event simulation (DES) to mimic kidney allocation within Eurotransplant. The simulator was developed in close collaboration with medical doctors from Eurotransplant and was presented on several occasions to ETKAC, which has welcomed the ETKidney simulator as a tool to inform policy discussions on kidney allocation. The Python code of the simulator is made publicly available together with synthetic data to enable collaborations with policymakers and scientists in evaluating alternative ETKAS and ESP allocation rules.11
In this chapter, we describe how kidneys are allocated within Eurotransplant (Section 8.2) and how this process is approximated by the simulator (Sections 8.3 and 8.4). We also give insight into how closely the simulator approximates outcomes of ETKAS and ESP with input-output validation (Section 8.5), and demonstrate how the ETKidney simulator can contribute to policy evaluation with three clinically relevant case studies (Section 8.6).
8.2 The kidney allocation programs of Eurotransplant
Figure 8.1 shows how Eurotransplant allocates the deceased-donor kidneys that become available for kidney-only transplantation.12 Three standard allocation programs are used to place these kidneys: the AM program, ETKAS and ESP (see Figure 8.1). The program through which Eurotransplant offers the kidney(s) is determined by the age of the donor. Kidneys from donors under the age of 65 are first offered for transplantation through the AM program, which accounted for 3% of kidney-only transplantations between 2014 and 2023, and then through ETKAS, which accounted for 69% of kidney-only transplantations. The ESP is used to allocate kidneys from donors aged 65 or older, and accounted for 16% of kidney-only transplantations [167].

Figure 8.1: Flow chart on how Eurotransplant offers kidneys for kidney-only transplantation. The percentages represent the fraction of kidney-only transplantations performed per mechanism between 2014 and 2023. Kidneys declined by all candidates in ESP were re-allocated via ETKAS until March 2021. Since March 2021, such kidneys are offered via extended ESP allocation, in which non-local candidates and those aged below 65 can participate since March 2021.
The remaining 11% of kidney-only transplantations between 2014 and 2023 resulted from non-standard allocation, which Eurotransplant can initiate if the loss of a transplantable graft is anticipated. In non-standard allocation, Eurotransplant offers the grafts to centers in the vicinity of the kidney(s), either through extended or rescue allocation. In extended kidney allocation, centers have 60 minutes to propose candidates. In rescue allocation, offers are competitive, which means that the first center to respond receives the kidney. Not all kidneys offered by Eurotransplant are eventually transplanted. In fact, approximately 24% of the kidneys that were offered by Eurotransplant for transplantation between 2014 and 2023 were discarded [168].
Match lists determine which candidate receives an offer at what moment. The composition and ordering of candidates on match lists are determined by program-specific eligibility, filtering, and ranking criteria. The eligibility criteria determine whether a candidate is allowed to appear on the match list under Eurotransplant kidney allocation rules. Examples of eligibility criteria are that the candidate must have the same blood group as the donor, and that the donor’s HLA must not include an HLA antigen that the center has reported as unacceptable for the candidate. The filtering criteria also determine whether Eurotransplant contacts the center to make an offer for a specific candidate. While eligibility criteria are rules imposed by Eurotransplant, filtering criteria represent the preferences that transplant centers have on kidney offers. The filtering criteria can be distinguished into:
- allocation profiles, with which centers can indicate that their patient does not want to receive offers from donors with certain characteristics (e.g. donors above a certain age, donors with a specific virology, or other donor-related characteristics), and
- HLA mismatch criteria, with which centers can specify their minimum requirements for the HLA match quality between the donor and candidate on the HLA-A, -B, and -DR loci.
Finally, the ranking criteria determine the position of a candidate on the match list. An overview of the ETKAS- and ESP-specific ranking criteria is included in Section 8.4.3.
In standard allocation, Eurotransplant only offers kidneys to candidates who appear on the filtered match list, which means that candidates must meet the program’s eligibility and filtering criteria. In extended allocation, centers are allowed to select candidates from the unfiltered match list, which means that candidates only have to meet the program’s eligibility criteria. In rescue allocation, centers can also propose other candidates for transplantation, including those with non-identical ABO blood groups.
8.3 Purpose and design of the ETKidney Simulator
We use discrete-event simulation (DES) to simulate kidney allocation according to the actual ETKAS and ESP allocation rules implemented in March 2021. Simulation of the AM program is beyond the scope of the ETKidney simulator, because the definition of acceptable antigens is based on an individualized risk-benefit analysis which requires specialized immunological knowledge. We note that the simulator has not been designed for the analysis of kidney discard rates.
Relevant states for the simulation are (i) the statuses of candidates on the ETKAS or ESP waiting lists, (ii) the export balances of Eurotransplant member countries, which affect a candidate’s rank on ETKAS match lists because of Eurotransplant’s balance point system (see Section 8.4.2). In DES, we study how these system states evolve in response to a series of discrete events. For the ETKidney simulator, we distinguish between three types of events, which are:
candidate status updates; these include changes to a candidate’s waiting list status (transplantable, non-transplantable, HU, removed, transplanted, or deceased), their allocation profiles, their unacceptable antigens, their HLA mismatch criteria, the reporting of an antibody screening, or a choice between ETKAS or ESP in Germany (where these programs are mutually exclusive),
donor arrivals; these are donors reported to Eurotransplant for whom one or two kidneys become available for kidney-only transplantation through ETKAS or ESP, which generally results in a transplantation, and
balance update events; these are transplantations across country borders through allocation programs other than ETKAS and ESP. These transplantations also count towards the export balances of Eurotransplant’s member countries, based on which balance points are awarded.
8.3.1 Input data for the ETKidney simulator
Users of the ETKidney simulator have to specify the input streams that define the candidate status updates and donor arrival events. Furthermore, an input stream of international transplantations can be specified, which is used to initialize ETKAS balances and to define balance update events. For candidates and donors, the data in the input streams must include all administrative and medical information required by the eligibility, filtering, and ranking criteria. Additional information may be required by the graft offer acceptance module to simulate the decision-making of kidney transplant centers in accepting kidney offers, and by the post-transplant module to simulate post-transplant survival.
For candidates, the input streams must include complete information on what would happen to each candidate until they exit the waiting list, either because of a waiting list removal or a waiting list death. This requirement implies that candidate input streams cannot be solely based on historical registry data: after all, waiting list removals or waiting list deaths have not been observed for candidates who were transplanted via ETKAS or ESP.
For simulations done in this chapter, we use input streams based on historical data. The actual status update trajectories of candidates are complemented with statuses copied over from comparable candidates who remained registered on the waiting list. For this, we use a procedure to complete a candidate’s status updates that was originally developed for the ELAS simulator (see Chapter 5 and Appendix B).
8.3.2 Initialization of the ETKidney simulator’s system state
The balance system is initialized using data from the input stream for international transplantations: all international transplantations that were performed prior to the simulation start date are processed, which ensures that the balances are correctly initialized. Additionally, the simulator schedules a balance update event for every cross-border transplantation that occurs within the simulation window via combined transplantations or via the AM program. This is necessary to accurately simulate the evolution of balances, because such transplantations also count towards a member country’s export balance.
From candidate input streams, the simulator loads all candidates who have an active status on the waiting list within the simulation window. The listings of candidates listed for repeat kidney transplantation whose initial transplantation takes place within the simulation window are excluded, which is necessary to ensure that a candidate cannot simultaneously wait for a primary and repeat transplantation in ETKidney simulation runs. For each candidate, a single patient event is scheduled in the Future Event Set (FES) timed at the candidate’s first available status update. The scheduling of subsequent status updates is postponed until the status update has been processed.
From donor input streams, all donors reported during the simulation window are loaded. For each donor, a donor event is scheduled in the FES on the donor reporting date.
8.3.3 Overview of the simulation
Figure 8.2 illustrates how events are processed in the simulation. The balance update events are handled by simply updating the export balances of the countries that were involved in the international transplantation. The patient events are handled by updating the status of the corresponding patient. Handling of donor events is more complex, because the allocation of the kidney(s) through ETKAS or ESP has to be approximated by the simulator.

Figure 8.2: Event handling flowchart for the ETKidney simulator. Inputs and parameters are represented using parallelograms. If a kidney is declined by all candidates, simulation settings determine whether a discard is recorded or a candidate is forced to accept the kidney for transplantation. FES, Future Event Set.
To approximate such kidney-only allocation, the ETKidney simulator’s match list module was developed (see Section 8.4.3). This module first creates, depending on the age of the donor, an unfiltered ETKAS or ESP match list that contains for each candidate who meets the corresponding program’s eligibility criteria a match record. These match records are automatically ordered based on the respective program’s ranking criteria, with the number of points awarded to each match record determined by the point score module (see Section 8.4.3).
Using the ordered match list as the input, the graft offering module simulates which candidates accept the kidneys (see Section 8.4.4). In rare cases, all candidates on the match list are simulated to decline the kidney offer. If this happens for an ESP match list, the graft offering module will try to place the kidneys through non-standard ESP allocation, which is how Eurotransplant allocates kidneys from donors aged 65 or older since March 2021. In the rare event that kidneys remain unplaced, the graft offering module can either (i) record a discard for the kidney(s), or (ii) force transplantation of the candidate who was predicted to be most likely to accept the graft. For the simulations in this chapter, option (ii) is used because the donor input stream used for simulation consists only of donors whose kidneys were actually transplanted through ETKAS and ESP.
After a graft has been accepted, transplantations are recorded with the kidney balances updated in case of a cross-border transplantation. The post-transplant module simulates post-transplant outcomes for transplant recipients. In case a candidate is simulated to enlist for repeat transplantation, this module also schedules a synthetic re-listing (see Section 8.4.5.2).
8.4 Modules of the ETKidney simulator
This section describes key modules of the ETKidney simulator: the HLA system module (Section 8.4.1), the balance system module (Section 8.4.2), the match list and point system module (Section 8.4.3), the graft offering module (Section 8.4.4), and the post-transplant module (Section 8.4.5).
8.4.1 The HLA system module
The HLA system module implements all mechanisms through which Eurotransplant prioritizes HLA matching. These procedures are (i) determining how many mismatches there are at the HLA loci of interest, (ii) calculating the vPRA on the basis of unacceptable antigens, and (iii) calculating the mismatch probability.
8.4.1.1 Calculation of HLA mismatches
The HLA system module can determine, for a given patient HLA and given donor HLA, how many antigen mismatches there are per locus (0, 1, or 2). The simulation settings file specifies at which HLA loci mismatches are to be determined. By default, the module only counts mismatches at the HLA-A, -B, and -DR loci, because the current ETKAS point system only awards points for these mismatches. HLA-A and HLA-B mismatches are determined at the level of broad antigens, while HLA-DR mismatches are determined at the level of split antigens (as is done for allocation in ETKAS, see [169]).
8.4.1.2 Quantification of virtual Panel-Reactive Antibodies (vPRA)
A candidate’s vPRA affects a candidate’s position on the match list because the vPRA is used to calculate the mismatch probability. In simulations included in this chapter the vPRA is quantified by counting the fraction of donors that carry unacceptable antigens in the ETRL donor panel (V4.0). This database includes the HLA phenotypes of 10,000 donors that were recently reported to Eurotransplant. The HLA system module can also quantify the vPRA against a user-specified input database of 10,000 donor HLAs.
8.4.1.3 Calculation of the Eurotransplant mismatch probability (MMP)
ETKAS awards points for the mismatch probability, which is the chance that there is no favorably matched donor for a candidate among the next 1,000 donors reported to Eurotransplant. Eurotransplant calculates this mismatch probability analytically as: \[\texttt{MMP} = \Bigl(1 - f_{BG}\cdot (1-\texttt{vPRA})\cdot p_{\leq1mm}\Bigr)^{1000},\] where \(f_{BG}\) is the candidate’s blood group frequency and \(p_{\leq1mm}\) is a quantification of the probability that a donor has at most 1 HLA-ABDR mismatch with the candidate.
By default, \(p_{\leq1mm}\) is calculated with analytic formulas for the probability of receiving exactly 0 mismatches and exactly 1 mismatch, which are also used for ETKAS allocation. A disadvantage of this approach is that both these formulas assume that HLA antigens are independently distributed according to their population frequencies, which ignores HLA linkage disequilibrium. To resolve this, the HLA system module can also quantify the availability of favorably matched donors by counting the number of 0- or 1-ABDR mismatched donors among the pool of 10,000 donors used to calculate the vPRA, which we denote by \(f_{\leq1mm}\). Using this quantity, we define the “1-ABDR HLA mismatch frequency” as \[\Bigl(1- f_{\leq1mm}\Bigr)^{1000}.\] We note that this quantity does not take into account the candidate’s blood group, nor the candidate’s vPRA. We use this quantity in the second case study (see Section 8.6.2).
8.4.2 The balance system module
To balance the international exchange of kidneys, Eurotransplant keeps track of the net kidney export balances of its member countries, and awards points in ETKAS based on these balances.13 Within Austria, an additional regional balance system exists to ensure that the Austrian regions benefit equally from cross-border transplantations [169]. The balance system module implements both these national and regional balance systems for the ETKidney simulator. Initialization of the net export balances is possible, and can be based on historical data. By default, separate balances are maintained for each donor age group (0-17 years, 18-49 years, 50-64 years, or 65 years or older), which is consistent with how balances have been maintained since April 1, 2019 [169].
8.4.3 The match list module & point system module
The match list module is used to create ETKAS or ESP match lists, which serve as input for the graft offering module. Only candidates who meet the corresponding program’s eligibility criteria appear on match lists, with each candidate ranked based on tiers and points. Candidates ranked in higher tiers receive priority over candidates in lower tiers. Within each tier, candidates are ranked by points. In ETKAS, tiers are in order of descending priority:
candidates with zero HLA-ABDR mismatches with the donor,
pediatric candidates, in case the donor is also pediatric,
all other candidates.
The ETKAS point system awards:
33.33 points per year of accrued dialysis time,
400 minus 66.66 points per HLA-ABDR mismatch. These points are doubled if the candidate is pediatric,
100 points if the candidate is pediatric,
500 points if the candidate has the High Urgency (HU) status,
up to 100 mismatch probability points,
balance points, the amount of which is determined based on the net export balances of Eurotransplant’s member countries,
up to 300 distance points if the candidate is located in the same country as the donor. The specific amount awarded depends on the country, see the kidney manual for an overview [169].
Since March 2021, ESP allocation has been based on nine tiers, which are defined based on the location of the candidate relative to the donor and whether the candidate is 65 years or older. Within ESP tiers points are awarded based on the dialysis time that a candidate has accrued [169].
8.4.4 The graft offering module
The graft offering module mimics how Eurotransplant offers kidneys to centers for transplantation, and returns, based on a match list, the candidates who accept the kidney for transplantation (if any). How kidney offers are simulated in the ETKidney simulator is illustrated in Figure 8.3. The module first simulates, based on the donor, the maximum number of offers made in standard allocation. We denote this number by \(k\). The module then makes kidney offers to candidates in order of their ranking on the filtered match list, either until \(k\) offers have been made or until all available kidneys have been accepted for transplantation.

Figure 8.3: Flow chart summarizing how the ETKidney simulator approximates the graft offering process.
If not all kidneys have been accepted after \(k\) offers in standard allocation, the match lists are re-ordered with priority for candidates located in the vicinity of the donor to approximate non-standard allocation. At this point, the module also makes offers to candidates who appear only on the unfiltered match list, as centers can select such candidates in extended and rescue allocation. Offers in non-standard allocation are made either until all kidneys have been accepted or until the match list is exhausted. The module then returns the candidates who have accepted the kidneys.
8.4.4.1 Simulating the switch to non-standard allocation
The graft offering module switches to non-standard allocation following \(k\) declines. We modeled \(K\) with a Cox proportional hazards model with adjustment for donor characteristics (donor age, virology, death cause, last creatinine, diabetes, smoking, proteinuria, blood group, and extended donor criteria). Cox models were stratified by the program (ETKAS / ESP), and within ETKAS additionally by the donor country. The baseline hazards and parameters needed to simulate from this model are made available with the ETKidney simulator. These were estimated on match lists generated between January 1, 2014, and January 1, 2024. ESP match lists from before March 2021 were excluded for estimation of these parameters, because non-standard allocation was rarely used in ESP before March 2021.14
8.4.4.2 Simulating kidney offer acceptance behavior with a two-staged approach
To simulate the center offer acceptance behavior of transplant centers, a two-stage acceptance procedure was implemented that
simulates center-level decisions based on donor characteristics (donor death cause, age, last creatinine, blood group, DBD / DCD donation, and extended donor criteria) and center characteristics (country, distance to the donor). These models simulate whether a center is willing to accept the kidney(s) for any candidate in the center, and
simulates patient-level decisions to determine whether the center accepts a kidney offer for a specific candidate. These decisions are simulated only if the center is willing to accept the donor, and are simulated based on donor characteristics (see above), candidate characteristics (age, pediatric status, HU status, vPRA, dialysis time, prior kidney transplantation), and match characteristics (HLA match, geographic distance, candidate-donor age difference).
Logistic models are used to simulate both center- and patient-level decisions. We anticipated that kidney offer acceptance behavior would differ between ETKAS and ESP, because HLA match quality has historically been ignored in ESP and because the programs have different donor and patient populations. Therefore, the ETKidney simulator uses separate models to simulate the offer acceptance behavior of transplant centers in ETKAS and ESP.
The odds ratios required for simulations are made publicly available with the ETKidney simulator, and were estimated on match lists with mixed effect logistic regressions. Random effects were included to account for within-donor, within-candidate and within-center correlations in organ offer acceptance decisions. For ETKAS, odds ratios were estimated on historical data between January 1, 2012, and January 1, 2021. For ESP, odds ratios were estimated between January 1, 2018, and January 1, 2024. We included data from after 2021 to estimate the ESP odds ratios, because ESP offers to candidates younger than 65 and international candidates have only been allowed since March 2021.
8.4.4.3 Simulation of dual kidney transplantations
Annually, approximately 20 to 30 candidates receive a dual kidney transplantation, a procedure that is permitted when loss of both grafts is anticipated or for specific anatomical reasons. The graft offering module simulates whether such a dual kidney transplantation is performed based on donor and patient characteristics (candidate age, donor age, country of listing, and rescue allocation). For this, a logistic model is used. The odds ratios provided with the ETKidney simulator were estimated on match lists from January 1, 2018, to January 1, 2024, using only offers where both grafts remained available for transplantation.
8.4.5 The post-transplant module
In total, 13% of the candidates on the kidney waiting list have received a prior kidney transplant, which makes it important to simulate post-transplant survival in the ETKidney simulator. This simulation is important even for short-term simulations, as nearly 3% of kidney transplant recipients enlist for a repeat kidney transplantation within one year of transplantation [170]. The post-transplant module was implemented to simulate survival after kidney transplantation and to simulate listing for repeat transplantation.
8.4.5.1 Simulation of post-transplant failure time and a potential re-listing date
For each kidney transplantation, the post-transplant module simulates a patient failure time \(t\) based on donor characteristics (age, DBD/DCD donor, last creatinine, death cause, hypertension, malignancy, diabetes), patient characteristics (age, dialysis time, repeat kidney transplantation, country of listing), and match characteristics (HLA match, standard or non-standard allocation, year of transplantation, international transplantation). This failure time is defined as a post-transplant death or a repeat kidney transplantation, whichever occurs first. We modeled \(T\) with a Weibull model based on recipient, donor, and transplantation characteristics (as done for the ELAS simulator, see Section 5.4.5.1). The scale and shape parameters supplied with the ETKidney simulator were estimated based on ETKAS and ESP transplantations that were performed between January 1, 2011, and January 1, 2021.
Most transplant recipients enlist for a repeat kidney transplantation before a patient failure materializes. Because a potential re-registration must logically occur before a patient death or re-transplantation, we simulate the time-to-relisting \(r\) based on the empirical distribution of \(R\) relative to \(T\) (explained in Section 5.4.5.2 for the ELAS simulator). For the ETKidney simulator, we stratified these distributions based on candidate age groups and time-until-failure \(t\), which both strongly affect whether a candidate is listed for repeat kidney transplantation (see Figure 8.4).
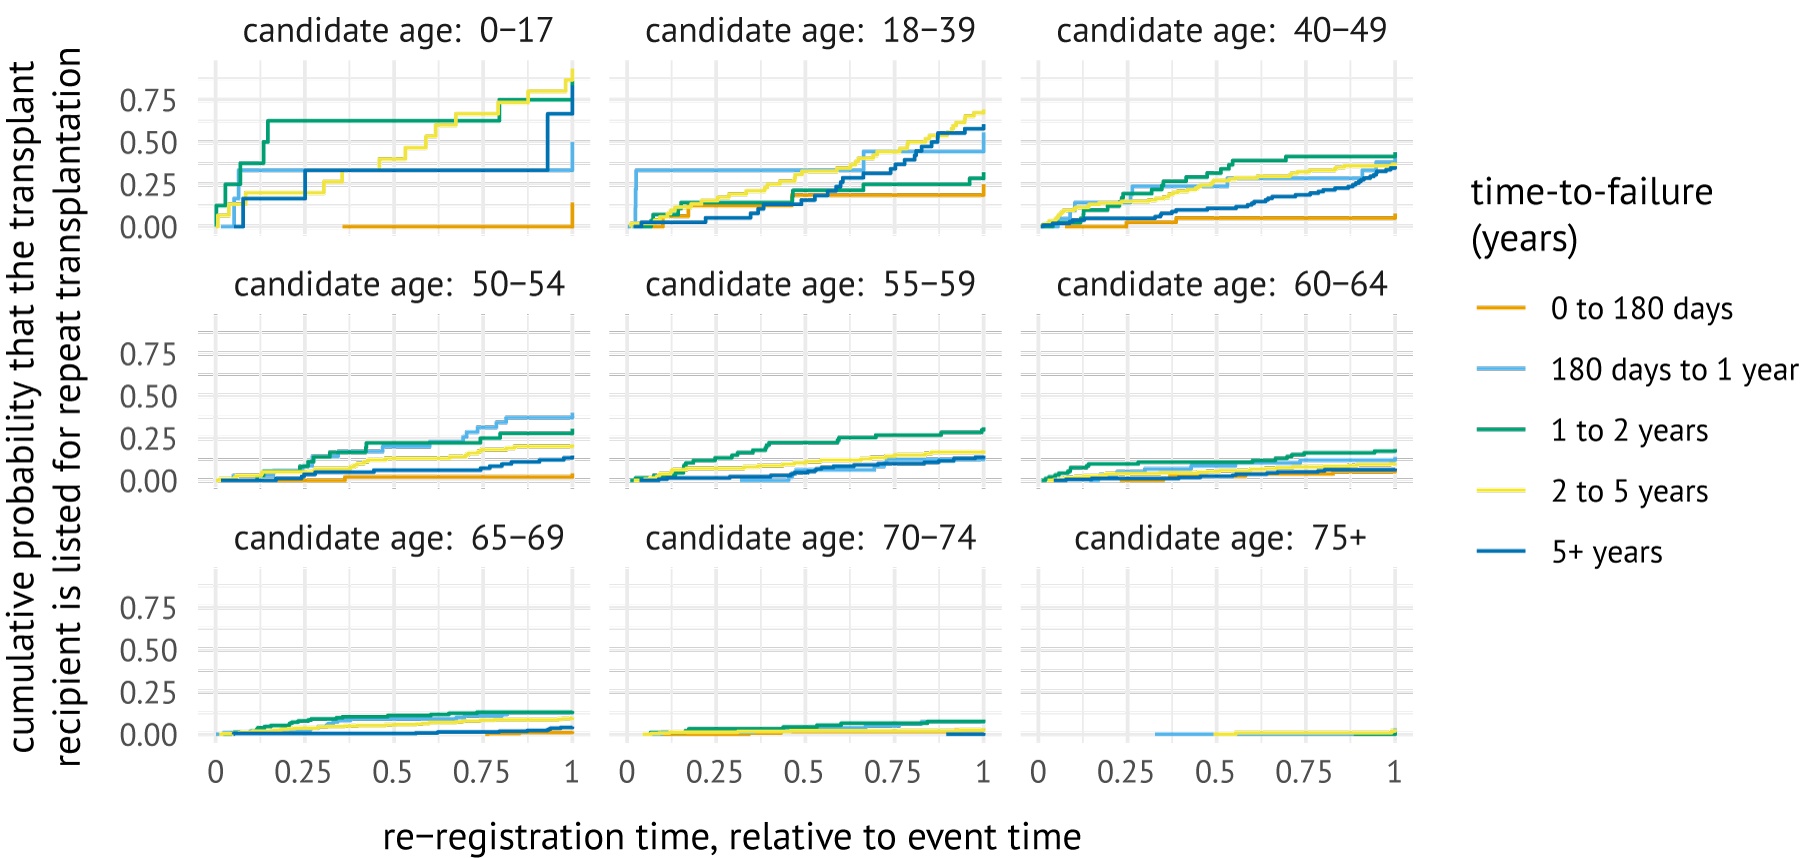
Figure 8.4: Cumulative incidence curves showing the probability of listing for repeat transplantation, stratified by time-to-event categories. These curves were estimated with the Kaplan-Meier estimator based on candidates transplanted between January 1, 2011, and January 1, 2024.
8.4.5.2 Constructing synthetic re-registrations
In case transplant recipients are simulated to enlist for a repeat transplantation before the simulation end date, the post-transplant module creates a synthetic re-listing for this candidate. This synthetic re-listing is created by combining the static information from the transplant recipient with the dynamic candidate status updates from an actually re-listed candidate. The actually re-listed candidate is chosen such that they are similar to transplant recipient in terms of background characteristics as well as in time-to-failure \(t\) and time-to-relisting \(r\).
By default, the post-transplant module finds a matching re-registration \(k\) by:
Considering re-listings where candidates match on country of listing and on whether they were re-listed within 1 year after transplantation15, are of similar age (<20 years difference), have similar time to re-listing and time-to-failure, and have a similar number of years on dialysis.
Selecting the m=5 listings for repeat transplantation with the closest Mahalanobis distance between (\(r_i\), \(t_i\)) and (\(r_k\), \(t_k\)).
Sampling a random re-registration from the \(m\) re-registrations.
A synthetic re-registration is then constructed by combining patient attributes from patient \(i\) with the urgency code updates and PRA re-certifications from patient \(k\). These status updates affect whether a candidate is eligible for a match list offer, as candidates with a non-transplantable status or outdated PRA screenings are not eligible for offers in ETKAS and ESP. Other status updates (vPRA, allocation profiles, diagnosis groups, HLA, reported dialysis initiation dates) are not copied over because they are considered patient-specific. We note that the PRA screenings are only used to determine the eligibility of the candidate, and not to predict graft offer acceptance behavior or post-transplant survival.
A specific challenge for simulating listing for repeat transplantation is that kidney transplantation is a strongly immunizing event [171]. Many repeat transplant candidates will therefore have developed de novo Donor-Specific Antibodies (dnDSAs) that centers can report as unacceptable. Candidates who are listed for repeat transplantation therefore tend to have higher vPRAs and face reduced access to kidney transplantation. It is not clear how to simulate such de novo immunization, because:
HLA antigens are cross-reactive, which means that patients typically also develop DSAs against HLA antigens that were not present in the donor [172],
the immunogenicity of donor HLAs also depends on the patient’s own HLA [172], and
HLA laboratories and transplant centers have different attitudes in labeling the HLA antigens of the initial donor as unacceptable [173], [174].
Accurate simulation of de novo immunization falls outside of the scope of the ETKidney simulator. Instead, a very simple procedure was implemented that assumes that candidates have a fixed probability of becoming immunized against any mismatched donor antigen. By default, this probability is set to 20%. This probability was chosen because having one additional mismatch per locus increases the probability of reporting unacceptable antigens against that specific locus with 10 to 25% on average (depending on the locus) [175].
8.5 Verification and validation
This section describes verification and validation efforts undertaken to ensure that the ETKidney simulator closely mimics ETKAS and ESP.
8.5.1 Verification of the ETKidney simulator
We built unit tests to ensure that the behavior of the modules aligns with their intended functionality. For example, unit tests were constructed to verify whether HLA match qualities returned by the HLA system module were equal to HLA match qualities recorded on actual ETKAS match lists. Unit tests were also used to ascertain that the HLA system module returned the correct mismatch probabilities and vPRAs.
The simulation of the graft offering process and of post-transplant survival is based on statistical models whose parameters were estimated in the statistical programming language R. Unit tests were constructed to ensure that the probabilities predicted in the ETKidney simulator based on these parameters matched the probabilities predicted in R, for both offer acceptance decisions as well as post-transplant survival.
8.5.2 Validation of the ETKidney simulator
To ensure face validity of the model, the conceptual design of the ETKidney simulator was discussed with ETKAC and ETRL. The model was also presented at the 2024 Eurotransplant Annual Meeting to collect feedback from additional stakeholders, such doctors and transplantation coordinators affiliated with the transplant centers.
We assess the operational validity of the model using input-output validation. For this, we simulate ETKAS and ESP kidney allocation between April 1, 2021, and January 1, 2024 under the actual allocation rules. The simulation start date of April 1, 2021 was chosen because the allocation of ESP donors changed in March 2021. For the donor input stream, we used all 4,326 donors reported in the simulation window whose kidneys were transplanted after allocation through ETKAS or ESP (see Table 8.1 for their characteristics). For the candidate input stream, we used all n=9,393 candidates activated on the ETKAS or ESP waiting list during the simulation period (Table 8.2), and the n=14,647 candidates already registered candidates on April 1, 2021 (Table 8.3).
| variable | level |
Austria (n=372) |
Belgium (n=627) |
Croatia (n=189) |
Germany (n=2,072) |
Hungary (n=265) |
Netherlands (n=704) |
Slovenia (n=97) |
|---|---|---|---|---|---|---|---|---|
| kidneys available | 2 |
260 (70%) |
471 (75%) |
127 (67%) |
1,625 (78%) |
208 (78%) |
532 (76%) |
71 (73%) |
| 1 |
112 (30%) |
156 (25%) |
62 (33%) |
447 (22%) |
57 (22%) |
172 (24%) |
26 (27%) |
|
| type | HB |
350 (94%) |
345 (55%) |
189 (100%) |
2,072 (100%) |
265 (100%) |
260 (37%) |
97 (100%) |
| NHB |
22 (6%) |
282 (45%) |
– | – | – |
444 (63%) |
– | |
| sex | female |
166 (45%) |
256 (41%) |
75 (40%) |
965 (47%) |
113 (43%) |
314 (45%) |
28 (29%) |
| male |
206 (55%) |
371 (59%) |
114 (60%) |
1,107 (53%) |
152 (57%) |
390 (55%) |
69 (71%) |
|
| age | 0-17 years |
22 (6%) |
16 (3%) |
15 (8%) |
85 (4%) |
12 (4%) |
12 (2%) |
9 (9%) |
| 18-49 years |
118 (32%) |
235 (38%) |
69 (36%) |
650 (31%) |
136 (51%) |
191 (27%) |
34 (35%) |
|
| 50-64 years |
166 (45%) |
264 (42%) |
70 (37%) |
786 (38%) |
100 (38%) |
291 (41%) |
37 (38%) |
|
| 65+ years |
66 (18%) |
112 (18%) |
35 (18%) |
551 (27%) |
17 (6%) |
210 (30%) |
17 (18%) |
|
| ABO blood group | O |
136 (37%) |
260 (42%) |
60 (32%) |
784 (38%) |
67 (25%) |
329 (47%) |
35 (36%) |
| A |
168 (45%) |
285 (46%) |
91 (48%) |
914 (44%) |
121 (46%) |
279 (40%) |
43 (44%) |
|
| B |
45 (12%) |
69 (11%) |
28 (15%) |
270 (13%) |
51 (19%) |
74 (10%) |
14 (14%) |
|
| AB |
23 (6%) |
13 (2%) |
10 (5%) |
104 (5%) |
26 (10%) |
22 (3%) |
5 (5%) |
|
| death cause | anoxia |
63 (17%) |
227 (36%) |
14 (7%) |
452 (22%) |
39 (15%) |
190 (27%) |
13 (13%) |
| CVA |
232 (62%) |
262 (42%) |
129 (68%) |
1,180 (57%) |
175 (66%) |
362 (51%) |
47 (48%) |
|
| trauma |
75 (20%) |
121 (19%) |
39 (21%) |
375 (18%) |
48 (18%) |
136 (19%) |
34 (35%) |
|
| other |
2 (0%) |
17 (3%) |
7 (4%) |
65 (3%) |
3 (1%) |
16 (2%) |
3 (3%) |
|
| Based on donors reported between April 1, 2021, and December 31, 2024, who had their kidneys allocated and transplanted via ETKAS or ESP. Abbreviations: HB, heartbeating; NHB, nonheartbeating |
| variable | level |
Austria (n=859) |
Belgium (n=1,461) |
Croatia (n=352) |
Germany (n=4,547) |
Hungary (n=665) |
Netherlands (n=1,406) |
Slovenia (n=103) |
|---|---|---|---|---|---|---|---|---|
| type transplant | primary |
721 (84%) |
1,278 (88%) |
328 (93%) |
3,978 (88%) |
609 (92%) |
1,173 (83%) |
88 (85%) |
| repeat |
138 (16%) |
183 (12%) |
24 (7%) |
569 (12%) |
56 (8%) |
233 (17%) |
15 (15%) |
|
| age | 0-17 years |
22 (3%) |
35 (2%) |
7 (2%) |
252 (6%) |
28 (4%) |
15 (1%) |
3 (3%) |
| 18-49 years |
279 (32%) |
467 (32%) |
124 (35%) |
1,617 (36%) |
283 (43%) |
351 (25%) |
44 (43%) |
|
| 50-64 years |
376 (44%) |
616 (42%) |
155 (44%) |
1,898 (42%) |
270 (41%) |
562 (40%) |
35 (34%) |
|
| 65+ years |
182 (21%) |
343 (24%) |
66 (19%) |
780 (17%) |
84 (13%) |
478 (34%) |
21 (20%) |
|
| ABO blood group | O |
332 (39%) |
656 (45%) |
132 (38%) |
1,730 (38%) |
182 (27%) |
617 (44%) |
42 (41%) |
| A |
365 (42%) |
583 (40%) |
130 (37%) |
1,962 (43%) |
303 (46%) |
522 (37%) |
44 (43%) |
|
| B |
108 (13%) |
159 (11%) |
72 (20%) |
618 (14%) |
121 (18%) |
210 (15%) |
14 (14%) |
|
| AB |
54 (6%) |
63 (4%) |
18 (5%) |
237 (5%) |
59 (9%) |
57 (4%) |
3 (3%) |
|
| vPRA at listing | 0% |
675 (79%) |
1,059 (72%) |
221 (63%) |
3,249 (72%) |
510 (77%) |
1,016 (72%) |
72 (70%) |
| >0-84.9% |
134 (16%) |
298 (20%) |
101 (29%) |
970 (21%) |
94 (14%) |
282 (20%) |
20 (19%) |
|
| 85+% |
50 (6%) |
104 (7%) |
30 (8%) |
328 (7%) |
61 (9%) |
108 (8%) |
11 (11%) |
|
| dialysis status | on dialysis |
803 (94%) |
1,247 (85%) |
327 (93%) |
4,479 (98%) |
586 (88%) |
1,057 (75%) |
96 (93%) |
| preemptive |
56 (6%) |
214 (15%) |
25 (7%) |
68 (2%) |
79 (12%) |
349 (25%) |
7 (7%) |
|
| dial. time at listing |
mean [Q1-Q3] |
1.7 [0.5-2.3] |
1.3 [0.0-1.7] |
1.6 [0.4-2.4] |
2.4 [0.8-3.0] |
1.2 [0.1-1.5] |
1.0 [0.0-1.1] |
2.4 [0.7-2.9] |
| Based on patients activated in ETKAS or ESP between April 1, 2021 and December 31, 2024. |
| variable | level |
Austria (n=807) |
Belgium (n=1223) |
Croatia (n=374) |
Germany (n=9513) |
Hungary (n=1006) |
Netherlands (n=1631) |
Slovenia (n=93) |
|---|---|---|---|---|---|---|---|---|
| status (Apr 1, 2021) | active |
563 (70%) |
907 (74%) |
135 (36%) |
6480 (68%) |
770 (76%) |
712 (44%) |
46 (50%) |
| inactive |
244 (30%) |
316 (26%) |
239 (64%) |
3033 (32%) |
236 (24%) |
919 (56%) |
47 (50%) |
|
| type transplant | primary |
581 (72%) |
972 (80%) |
304 (81%) |
7813 (82%) |
941 (94%) |
1321 (81%) |
74 (80%) |
| repeat |
226 (28%) |
251 (20%) |
70 (19%) |
1700 (18%) |
65 (6%) |
310 (19%) |
19 (20%) |
|
| age (Apr 1, 2021) | 0-17 years |
5 (1%) |
16 (1%) |
5 (1%) |
159 (2%) |
14 (1%) |
9 (1%) |
0 (0%) |
| 18-49 years |
264 (33%) |
433 (35%) |
144 (38%) |
3334 (35%) |
404 (40%) |
392 (24%) |
36 (39%) |
|
| 50-64 years |
401 (50%) |
532 (44%) |
149 (40%) |
4639 (49%) |
402 (40%) |
691 (42%) |
40 (43%) |
|
| 65+ years |
137 (17%) |
242 (20%) |
76 (20%) |
1381 (14%) |
186 (18%) |
539 (33%) |
17 (18%) |
|
| ABO blood group | O |
408 (51%) |
654 (54%) |
145 (39%) |
4216 (44%) |
368 (37%) |
826 (51%) |
38 (41%) |
| A |
239 (30%) |
332 (27%) |
133 (36%) |
3468 (36%) |
372 (37%) |
478 (29%) |
24 (26%) |
|
| B |
131 (16%) |
200 (16%) |
75 (20%) |
1383 (14%) |
206 (20%) |
278 (17%) |
22 (24%) |
|
| AB |
29 (4%) |
37 (3%) |
21 (6%) |
446 (5%) |
60 (6%) |
49 (3%) |
9 (10%) |
|
| vPRA group | 0% |
479 (59%) |
694 (57%) |
189 (50%) |
5573 (59%) |
717 (71%) |
1085 (66%) |
50 (54%) |
| >0-84.9% |
209 (26%) |
299 (24%) |
100 (27%) |
2650 (28%) |
173 (17%) |
337 (21%) |
19 (20%) |
|
| 85+% |
119 (15%) |
230 (19%) |
85 (23%) |
1290 (14%) |
116 (12%) |
209 (13%) |
24 (26%) |
|
| dialysis status | on dialysis |
789 (98%) |
1164 (95%) |
358 (96%) |
9497 (100%) |
924 (92%) |
1455 (89%) |
90 (97%) |
| preemptive |
18 (2%) |
59 (5%) |
16 (4%) |
16 (0%) |
82 (8%) |
176 (11%) |
3 (3%) |
|
| dial. years (Apr 1, 2021) |
mean [Q1-Q3] |
3.2 [1.5-4.2] |
3.1 [1.1-4.1] |
3.4 [1.6-4.2] |
5.7 [3.1-7.7] |
3.0 [1.2-4.3] |
1.9 [0.0-2.8] |
4.0 [1.8-5.5] |
| Based on patients listed in ETKAS or ESP before April 1, 2024, with at least one active status in this period. |
To enable accurate simulation of the ETKAS balance system, we also exported from the Eurotransplant database all cross-border transplantations that followed allocation via the AM program or were a combined transplantation. These transplantations were used to define the input stream of international transplantations. In simulations, we schedule donor arrivals, candidate status updates, and balance update events on the dates this information was actually reported to Eurotransplant. Our input-output validation exercise thus keeps the inputs as close as possible to reality, and assesses whether the outputs of the ETKidney simulator are comparable to the actual outputs of ETKAS and ESP.
Importantly, the outputs of the simulator depend on several stochastic processes: the offer acceptance behavior of the transplant centers, listing for a repeat transplantation after an initial kidney transplantation, and the switching to non-standard allocation by Eurotransplant. To give insight into variability of simulator outputs, we simulate ETKAS and ESP allocation 200 times over the simulation window and report 95% interquantile ranges for relevant summary statistics. These 95% IQRs are obtained by simulating allocation 200 times and reporting the 2.5th and 97.5th percentiles of simulation outputs. For each of these 200 simulation runs, we use a different set of completed status trajectories (see Section 8.3.1). We say that the ETKidney simulator is “well-calibrated” for a quantity of interest if the observed summary statistic falls within the 95% IQR of the 200 simulations.
Results of input-output validation
Table 8.4 reports results of this input-output validation for kidney waiting list outcomes. The ETKidney simulator is well-calibrated for almost all summary statistics: the total number of transplantations, the number of dual kidney transplantations, the number of ETKAS or ESP transplantations, the number of re-listings, and the number of waiting list deaths per country in all countries. We only observe miscalibration for the number of waiting list deaths in Hungary (-11%) and the active waiting list size at simulation termination (2% too many candidates have an active waiting list status). Table 8.5 reports input-output validation results for ETKAS and ESP transplantations. For ETKAS, the simulator is well-calibrated for the number of transplantations placed by allocation mechanism (standard or non-standard), transplantations by candidate age group, and transplantations in repeat transplant candidates. The simulator is also well-calibrated for the number of transplantations by HLA match quality, with only the number of zero-mismatched transplantations overestimated (%). The number of transplantations in candidates with vPRAs exceeding 95% is underestimated (-17%). This miscalibration appears to have been the result of the introduction of the virtual crossmatch in January 2023, potentially because the number of positive crossmatches in the recipient center decreased after the introduction of the virtual crossmatch in Eurotransplant [176] (see Table 8.6 for miscalibration after January 2023). The simulator is well-calibrated for the number of transplantations per country, with only a slight overestimation observed in Croatia (%) and a slight underestimation observed in Hungary (-2%). The degree of geographical sharing is underestimated in ETKAS: there are too many local or regional transplantations in simulations (%), and too few inter-regional (-11%) or international (-9%) transplantations.
Table 8.5 also shows that the ETKidney simulator is well-calibrated for most relevant outcomes in ESP: the number of transplantations in primary and repeat kidney transplant candidates, and the number of transplantations by HLA match quality and immunization status. The simulator overestimates the number of kidneys transplanted after non-standard allocation in ESP (+23%). An apparent consequence of this is that the number of kidneys allocated to candidates under the age of 65 is overestimated (%), particularly in Belgium, the Netherlands, and Slovenia where centers appear to be reluctant to transplant a candidate under the age of 65 with an ESP donor (see Table 8.7). Finally, the simulator is well-calibrated for the number of transplantations by recipient country and match geography, with the only exception Germany where 2% too many ESP kidneys are transplanted.
Overall, the ETKidney simulator appears to be well-calibrated for most outcomes of ETKAS and ESP allocation. The results of this input-output validation exercise were discussed with medical doctors from Eurotransplant and ETKAC, who deemed differences small enough to make the simulator useful for determining the impact of alternative kidney allocation policies. We illustrate this with case studies in the next section.
| category |
simulated results (average and 95% IQR) |
actual data (2021-2024) |
|---|---|---|
| transplantations through ETKAS or ESP | ||
| number of unique donors | 4326 | 4326 |
| number of transplantations | 7545.7 [7530-7560] | 7549 |
| number of transplantations by type | ||
| single kidney | 7471.4 [7440-7500] | 7484 |
| dual kidney | 74.3 [60-90] | 65 |
| number of transplantations by allocation mechanism | ||
| ESP | 1740.4 [1727-1752] | 1745 |
| ETKAS | 5805.3 [5797-5814] | 5804 |
| waiting list | ||
| initial active waiting list | 9589 | 9589 |
| number of listings | 24028.2 [24010-24046] | 24038 |
| re-listings in simulated period | 106.2 [88-124] | 116 |
| final active waiting list size | 10142.4 [10095-10194] | 9958 |
| waiting list removals (count) | 1449.1 [1427-1473] | 1469 |
| waiting list deaths (count) | 1145.5 [1122-1165] | 1140 |
| number of waiting list deaths by country | ||
| Austria | 73.3 [67-80] | 73 |
| Belgium | 81.6 [73-90] | 73 |
| Croatia | 40.4 [36-46] | 40 |
| Germany | 722.9 [705-740] | 713 |
| Hungary | 128.4 [121-135] | 144 |
| Netherlands | 91.7 [84-99] | 90 |
| Slovenia | 7.1 [5-10] | 7 |
| category |
simulated results (average and 95% IQR) |
actual |
simulated results (average and 95% IQR) |
actual |
|---|---|---|---|---|
| allocation mechanism | ||||
| standard | 5044 [4881-5169] | 5000 | 1117 [1049-1188] | 1237 |
| non-standard | 761 [632-915] | 804 | 623 [551-690] | 508 |
| recipient characteristics | ||||
| pediatric recipient | 339 [321-358] | 325 | 0 | 0 |
| aged 65 or over | 734 [700-769] | 725 | 1512 [1475-1548] | 1567 |
| aged below 65 | 5071 [5034-5105] | 5079 | 228 [192-261] | 178 |
| primary transplant | 5038 [5001-5068] | 5039 | 1661 [1644-1677] | 1665 |
| repeat transplant | 768 [734-795] | 765 | 80 [67-92] | 80 |
| HLA match quality | ||||
| 0 ABDR | 650 [624-675] | 617 | 3 [1-6] | 4 |
| 0 or 1 BDR | 1136 [1083-1179] | 1153 | 62 [50-77] | 55 |
| 1B+1DR or 2B+0DR | 2468 [2406-2534] | 2492 | 316 [285-348] | 336 |
| 2DR or 3+ BDR | 1551 [1490-1609] | 1542 | 1360 [1328-1388] | 1350 |
| sensitization status | ||||
| 0% | 4211 [4173-4255] | 4142 | 1477 [1455-1502] | 1468 |
| >0-84.9% | 1320 [1279-1356] | 1355 | 256 [233-278] | 264 |
| 85-94.9% | 173 [155-191] | 186 | 6 [2-10] | 9 |
| 95+% | 101 [87-114] | 121 | 2 [1-3] | 4 |
| match geography | ||||
| Austria | 532 [525-538] | 530 | 106 [87-128] | 118 |
| Belgium | 912 [905-918] | 914 | 107 [83-132] | 120 |
| Croatia | 277 [272-283] | 270 | 38 [26-51] | 26 |
| Germany | 2648 [2635-2659] | 2651 | 1081 [1049-1118] | 1048 |
| Hungary | 464 [457-470] | 472 | 19 [11-28] | 24 |
| Netherlands | 854 [847-860] | 849 | 380 [349-406] | 398 |
| Slovenia | 119 [113-124] | 118 | 9 [4-15] | 11 |
| local/regional | 4087 [3993-4164] | 3902 | 1374 [1324-1424] | 1408 |
| interregional | 637 [590-680] | 715 | 174 [138-206] | 178 |
| international | 1081 [1012-1164] | 1187 | 192 [153-225] | 159 |
| vPRA |
simulated (mean, 95% IQR) |
actual |
simulated (mean, 95% IQR) |
actual |
|---|---|---|---|---|
| 0% | 2751 [2711-2792] | 2755 | 1460 [1428-1489] | 1387 |
| 0.01-84.9% | 875 [842-909] | 861 | 446 [417-474] | 494 |
| 85-94.9% | 114 [99-128] | 117 | 59 [48-69] | 69 |
| 95+% | 67 [56-78] | 75 | 34 [25-44] | 46 |
| recipient country |
simulated (mean, 95% IQR) |
actual |
|---|---|---|
| Austria | 19 [12-28] | 20 |
| Belgium | 14 [6-23] | 3 |
| Croatia | 13 [7-21] | 8 |
| Germany | 156 [131-184] | 139 |
| Hungary | 3 [1-6] | 6 |
| Netherlands | 18 [8-30] | 1 |
| Slovenia | 5 [2-10] | 1 |
8.6 Case studies
Together with ETKAC, three topics for case studies were selected in which the ETKidney simulator could help quantify the impact of alternative kidney allocation rules. The selected topics all concern the ETKAS program, and are (i) emphasizing matching at the HLA-B and HLA-DR locus, (ii) the introduction of a sliding scale based on the vPRA, and (iii) candidate-donor age matching. To limit the effects of transient effects, we extend the simulation period for these case studies from January 1, 2016 to January 1, 2024. We simulate all policy alternatives 20 times, and use traditional hypothesis testing to assess whether alternative policies significantly change the outcomes compared to the current policy. To increase the power of these tests, we use common random numbers [100] as a variance reduction technique. Consequently, the outcomes that are simulated under the alternative allocation rules can be compared to the outcomes simulated under the current rules with pairwise t-tests.
8.6.1 Case study 1: emphasizing matching at HLA-B and HLA-DR loci
Since its initiation in 1996, the ETKAS point system has placed equal emphasis on matching at the HLA-A, HLA-B, and HLA-DR loci, despite broad consensus that HLA-DR mismatches are more deleterious to graft survival than HLA-A and HLA-B mismatches [129], [157]. Internal analyses on registry data from Eurotransplant suggest that mismatches on the HLA-B and HLA-DR locus are indeed more strongly associated with graft loss than mismatches on the HLA-A locus. This motivated us to simulate policies that emphasize matching at the HLA-B and HLA-DR loci relative to the HLA-A locus.
The current ETKAS point system awards 400 points for HLA matching and penalizes HLA mismatches on the A, B, and DR loci with 66.7 points per mismatch. We assess the impact of three alternative HLA matching policies. These policies all continue to award up to 400 points for candidate-donor HLA match quality, but shift weight from the HLA-A locus to the HLA-B and HLA-DR loci (see Table 8.8). The first policy is referred to as the \(\text{B} + 2\text{DR}\) policy, because it gives no weight to the HLA-A locus, maintains the same weight for the HLA-B locus (-66.7 points), and doubles the weight on the HLA-DR locus (-133.3 points). The second policy, referred to as the \(0.5\text{A} + \text{B} + 1.5\text{DR}\) policy, shifts only half of the weight placed on the HLA-A locus to the HLA-DR locus. The final policy, referred to as \(1.5\texttt{B} + 1.5\texttt{DR}\), penalizes mismatches at the HLA-B and HLA-DR loci both with 100 points per mismatch.
| policy | A | B | DR |
|---|---|---|---|
| current | -66.7 | -66.7 | -66.7 |
| B + 2DR | 0 | -66.7 | -133.3 |
| \(0.5\)A + B + \(1.5\)DR | -33.3 | -66.7 | -100 |
| \(1.5\)B + \(1.5\)DR | 0 | -100 | -100 |
Simulation results for these three alternative policies are summarized in Table 8.9. These results show that the policy alternatives reduce the number of transplantations with 2 DR or 3 or more BDR mismatches by 25 to 39%, and increase the number of transplantations with 1 B or 1 DR mismatch by 26 to 49%. Thus, the policies indeed succeed in improving match quality on the HLA-B and HLA-DR locus.
| variable | |||||||
|---|---|---|---|---|---|---|---|
| ABDR mismatch count | |||||||
| 0 | 1925 | -9 | (-0%) | -1 | (-0%) | -6 | (-0%) |
| 1 | 952 | -181††† | (-19%) | -55††† | (-6%) | -99††† | (-10%) |
| 2 | 3855 | -634††† | (-16%) | -252††† | (-7%) | -509††† | (-13%) |
| 3 | 6037 | -358††† | (-6%) | -76††† | (-1%) | -224††† | (-4%) |
| 4 | 3235 | +837††† | (+26%) | +282††† | (+9%) | +642††† | (+20%) |
| 5 | 730 | +340††† | (+47%) | +104††† | (+14%) | +191††† | (+26%) |
| 6 | 78 | +2 | (+3%) | 0 | (0%) | +7† | (+9%) |
| ABDR match quality | |||||||
| 000 | 1925 | -9 | (-0%) | -1 | (-0%) | -6 | (-0%) |
| _00, _10, _01 | 3264 | +1364††† | (+42%) | +850††† | (+26%) | +1585††† | (+49%) |
| _20, _11 | 7234 | +209††† | (+3%) | +240††† | (+3%) | +131††† | (+2%) |
| __2, _21 | 4388 | -1567††† | (-36%) | -1087††† | (-25%) | -1708††† | (-39%) |
| candidate homozygosity on HLA-B and DR | |||||||
| B and DR | 473 | -39††† | (-8%) | -17††† | (-4%) | -30††† | (-6%) |
| DR | 1662 | -207††† | (-12%) | -104††† | (-6%) | -94††† | (-6%) |
| B | 1052 | +31††† | (+3%) | +14†† | (+1%) | -19††† | (-2%) |
| none | 13625 | +212††† | (+2%) | +110††† | (+1%) | +144††† | (+1%) |
| † p < 0.05, †† p < 0.01, ††† p < 0.001 | |||||||
However, results also show that there are unintended consequences of this policy: the total number of ABDR mismatches at transplantation increases with all alternative policies and there are 5 to 12% fewer transplantations in candidates who have homozygosity at the HLA-B or HLA-DR loci, who are already disadvantaged in the current ETKAS system. Results such as those presented in Table 8.9 can facilitate discussions by ETKAC on whether the improved match quality at HLA-B and HLA-DR loci is worth the increase in total mismatches and the reduced access to kidney transplants for homozygotes.
8.6.2 Case study 2: a sliding scale for the vPRA
Prior studies have suggested that immunized candidates have reduced access to transplantation in ETKAS (see [134], [135] and Chapter 7). In this case study, we assess whether this disparity can be alleviated by awarding points directly for the vPRA. For this, we modify the ETKAS point system in two ways. The first modification is that we directly award points for the vPRA using a sliding scale. Such a sliding scale for the vPRA has been a part of kidney allocation in the United States since 2014 [177]. The number of points awarded based on this sliding scale is calculated as \[\texttt{weight}\cdot\frac{\texttt{base}^{\texttt{vPRA}}}{\texttt{base}-1}.\] The maximum number of points awarded by the sliding scale depends on its weight, and its steepness depends on the base. The second modification is that we no longer directly award points for the vPRA via the mismatch probability. Instead, we replace mismatch probability points by the 1-ABDR HLA mismatch frequency (see Section 8.4.1.3). This quantity awards points to candidates based on how difficult-to-match their HLA phenotype is, and not their blood group or their vPRA.
Representatives of ETKAC reached consensus that the aim of the sliding scale should be that a candidate’s chance of being transplanted through ETKAS should not decline up to a vPRA of 85%. Above this vPRA, candidates could have access to the AM program, or should consider removing unacceptable antigens in case they do not meet AM criteria. We used the ETKidney simulator to simulate ETKAS for different combinations of weights and bases, and quantify the association between vPRA and the relative transplant rate using Cox proportional hazards model on the outcomes simulated by the ETKidney simulator. For this, the same model specification is used as in Chapter 7. In Figure 8.5 the estimated relation between vPRA and the transplant rate is shown for several sliding scales. From this figure, the sliding scale with a base of 5 and weight of 133 appears to be the most acceptable option: with this sliding scale, the relative transplant rate of sensitized candidates no longer decays until a vPRA of 85%, as was desired by ETKAC.
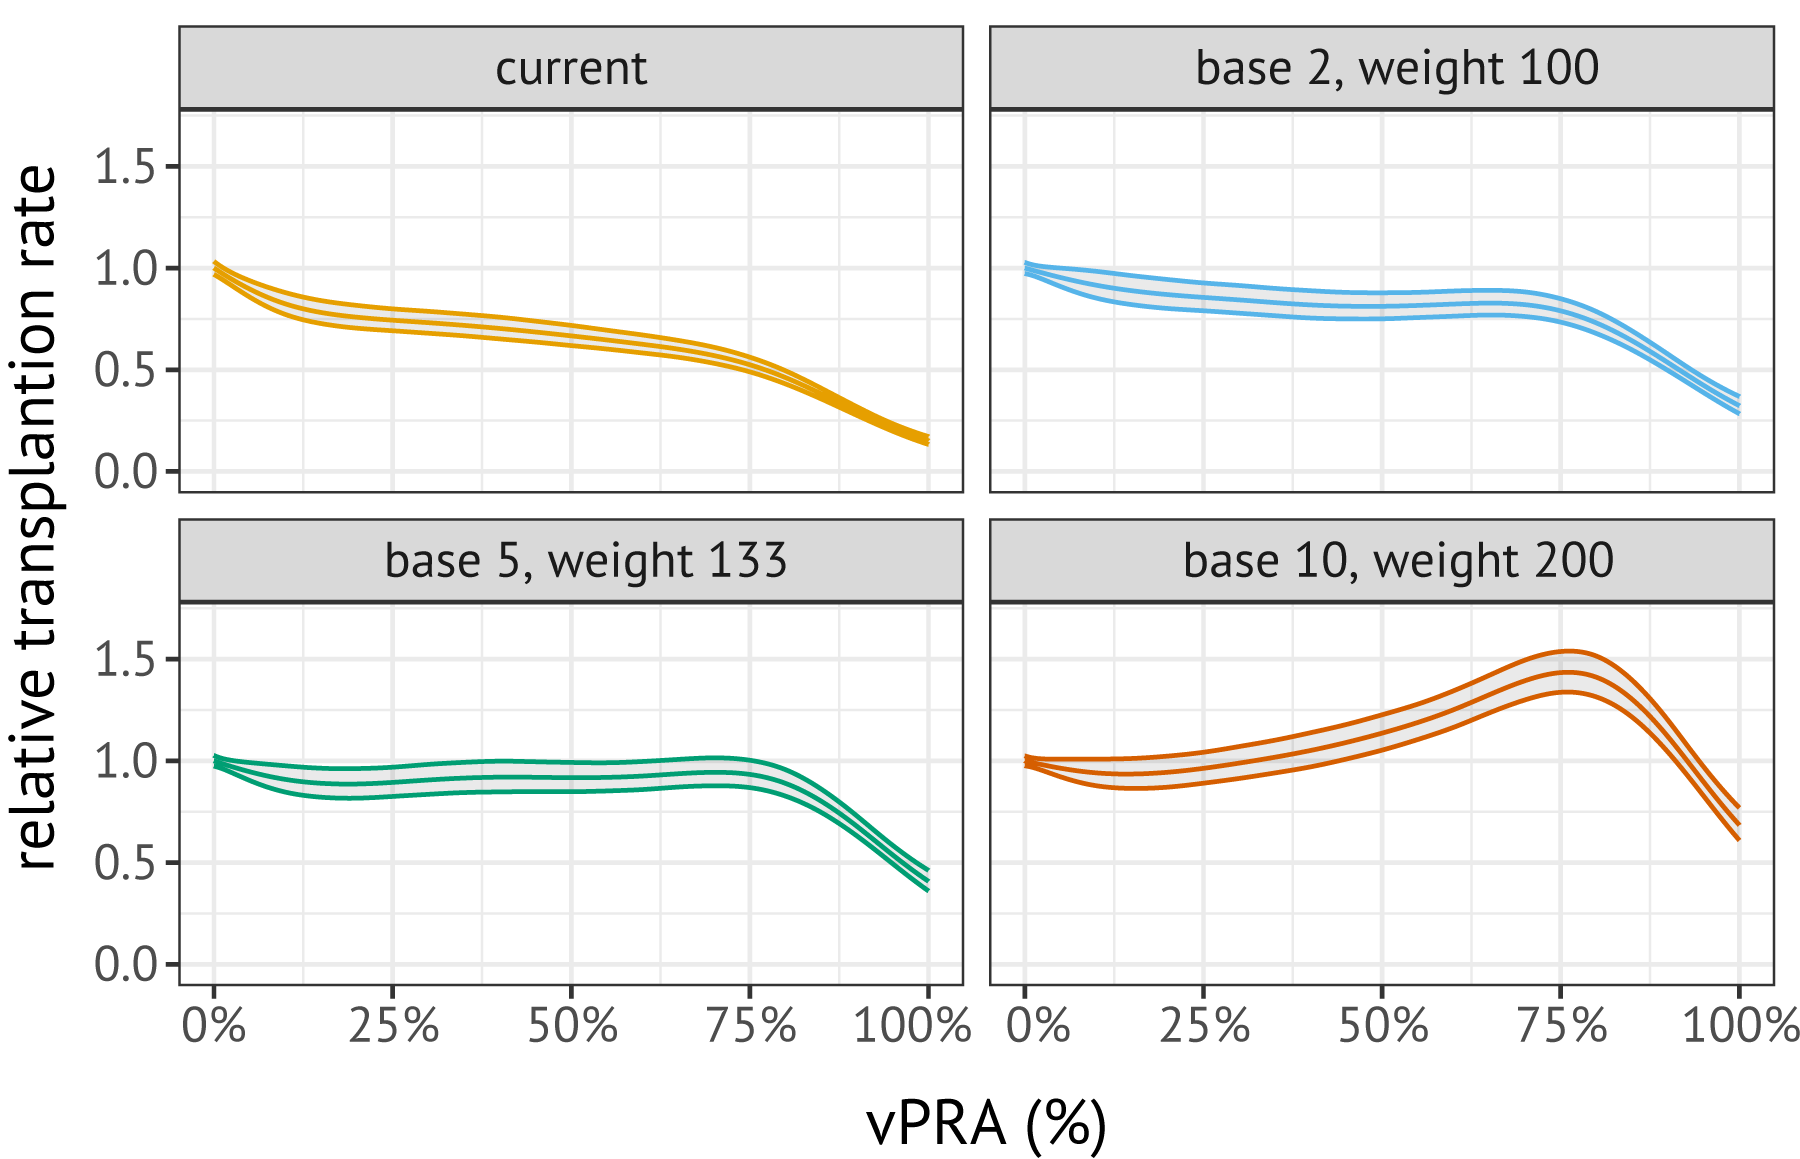
Figure 8.5: Relations between the relative transplant rate and the vPRA in ETKAS, estimated on ETKidney simulator outcomes. These relations were estimated with a Cox proportional hazards model, using a spline transformation for the vPRA.
8.6.3 Case study 3: candidate-donor age matching
Consensus in the transplantation literature is that kidneys procured from young donors should preferentially be transplanted in young candidates [178], [179], [180], [181], [182]. While allocation systems in France and the United Kingdom have implemented mechanisms that explicitly award points for continuous candidate-donor age matching [147], [148], the ETKAS point system does not award points based on candidate or donor age (except for bonus points that are given to pediatric patients). In this case study, we (i) use retrospective data from Eurotransplant to quantify the associations of candidate and donor age with patient and graft survival with cause-specific hazard models, and (ii) simulate and evaluate two age matching policies for ETKAS.
To quantify the relation between donor or candidate age and post-transplant survival, we consider all patients transplanted with a kidney through ETKAS or ESP between 2004 and 2019. We exclude candidates with the HU status and candidates without any follow-up information (n = 7,458), leaving n = 36,576 transplantations. We fit cause-specific Cox proportional hazards models on these transplantations for (i) graft loss and (ii) death with a functioning graft. We censored both time-to-event variables ten years after transplantation, because completeness of follow-up data beyond this time horizon is poor (available for less than 30% of patients). Besides donor and candidate age, we adjust for donor characteristics (DCD/DCD donation, hypertension, last creatinine, death cause, diabetes, malignancy), candidate characteristics (dialysis time), and match characteristics (a zero-mismatch indicator, the number of mismatches per locus for the HLA-A, -B, and -DR loci, and match geography). To allow for non-linear relations between continuous variables and the hazard rate, we adjust for spline transformations of the continuous variables. The estimated relations between donor or candidate age and patient and graft survival are shown in Figure 8.6. These results are qualitatively similar to results obtained by Coemans et al. [181], who report that the hazard rate of graft loss decays linearly with recipient age while it increases quadratically with donor age, and that the mortality hazard rate increases quadratically with candidate age (note that the y-axis for the second panel is shown on the logarithmic scale).
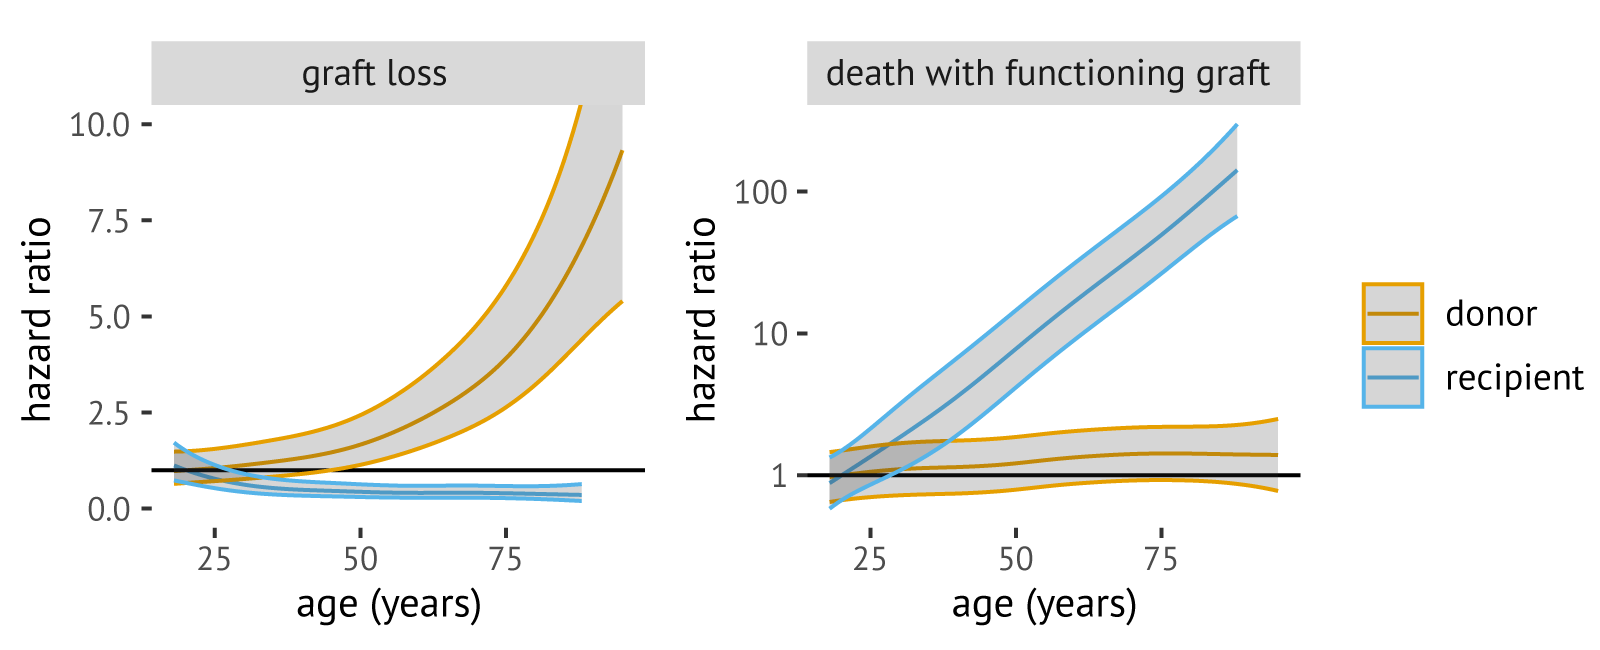
Figure 8.6: Estimated relations between graft loss and death with a functioning graft. Note that the hazard ratio for death with a functioning graft is shown on the logarithmic scale.
We simulate two candidate-donor age matching policies, both inspired by the French kidney allocation policy that was introduced in 2015 [147]. Like ETKAS, the French policy awards points for candidate waiting time, HLA matching between the donor and candidate, the candidate’s likelihood of being favorably matched with a kidney, and the geographic distance between the donor and candidate. However, in France an “age filter” is applied to the total number of points awarded, with candidates ranked based on the filtered number of points. For example, the French age filter is 0% for a candidate who is over 20 years older than the donor, which means that such candidates receive 0% of their total points for ranking. The French age filter is asymmetrical with allocation of kidneys from a young donor to an older patient discouraged more strongly than the allocation of a kidney from an older donor to a young candidate.
Inspired by this French age filter, we evaluate two asymmetrical age filters for ETKAS (see Figure 8.7). Both filters give a candidate 100% of their ETKAS points in case the age difference between the candidate and donor is 5 years or less. The “strict” filter (blue) is similar to the French age filter in that it gives almost no points in case the candidate is much older than the donor. The “muted” filter (orange) gives a larger fraction of the total number of ETKAS points, which we anticipated to be more acceptable for Eurotransplant because it maintains a better balance in the international exchange of kidneys.
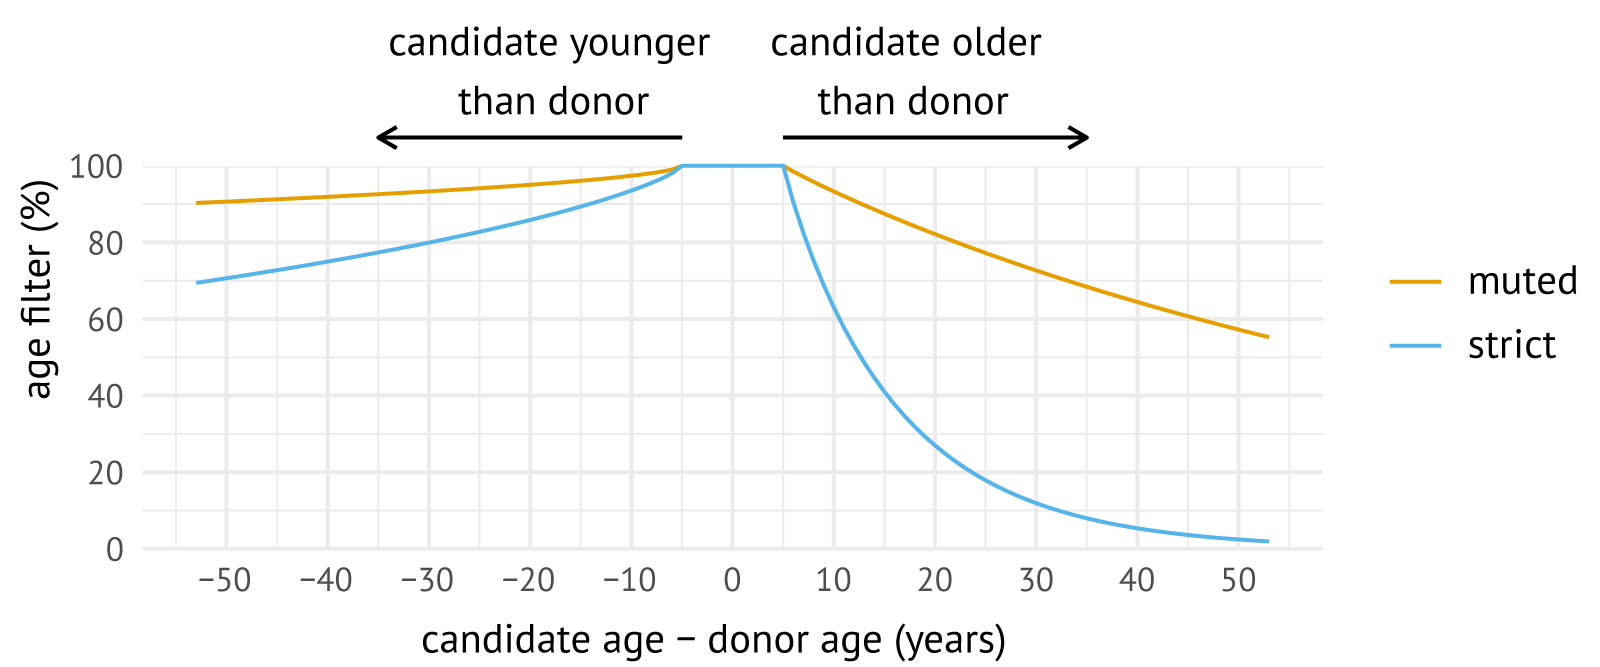
Figure 8.7: Evaluated age filters for ETKAS.
Simulated outcomes for the muted and strict age matching policies are compared to the current policy in Table 8.10. The table shows that the muted and strict policies increase the number of age-matched transplantations (defined as transplantations with a candidate-donor age difference of at most five years) by 60% and 138%, respectively. An unintended consequence is that the muted and strict age filters lead to reduced HLA match quality at transplantation, with a 12% and 33% increase in the number of level 4 mismatched kidney transplantations (2 DR, or 3 or 4 B+DR mismatches), respectively. Table also 8.10 shows that the muted policy only modestly increases international sharing (+5%) and inter-regional sharing (+7%), while the strict policy leads to a 37% increase in international transplantations. The strict age filter increases the number of extended or rescue transplantations (+7%), potentially because international offers are relatively more likely to be declined.
To evaluate whether the benefits of candidate-donor age matching outweigh its unintended consequences, we use the earlier mentioned cause-specific hazard models to predict the probability of death with a functioning graft ten years after transplantation for all simulated transplantations. For this, we predict the cumulative incidence of death with functioning graft using a cause-specific hazards approach [183]. By summing up these 10-year event probabilities for all candidates, we obtain the expected number of events ten years after transplantation, which is visualized in Figure 8.8 for the current policy (green), the muted age filter (orange), and the strict age filter (blue). These results suggest that the muted and strict age filter could reduce the numbers of deaths with a functioning graft 10 years after transplantation by 11% and 18%, respectively.
| variable | |||||
|---|---|---|---|---|---|
| age difference | |||||
| candidate 35+ years older | 708 | -497*** | (-70%) | -557*** | (-79%) |
| candidate 15-34 years older | 3166 | -1742*** | (-55%) | -2549*** | (-81%) |
| candidate 6-14 years older | 3256 | +434*** | (+13%) | -1756*** | (-54%) |
| max 5 year difference | 4810 | +2919*** | (+61%) | +6640*** | (+138%) |
| candidate 6-14 years younger | 2624 | -151*** | (-6%) | -230*** | (-9%) |
| candidate 15-34 years younger | 2064 | -873*** | (-42%) | -1386*** | (-67%) |
| candidate 35+ years younger | 184 | -86*** | (-47%) | -155*** | (-84%) |
| ABDR match quality | |||||
| level 1 (0 ABDR mm) | 1922 | -8 | (-0%) | -40*** | (-2%) |
| level 2 (at most 1 BDR mm) | 3250 | -380*** | (-12%) | -902*** | (-28%) |
| level 3 (2B or 1DR+1B mm) | 7224 | -156*** | (-2%) | -496*** | (-7%) |
| level 4 (2DR or 3+BDR mm) | 4417 | +547*** | (+12%) | +1446*** | (+33%) |
| match geography | |||||
| local or regional | 11744 | -297*** | (-3%) | -1514*** | (-13%) |
| national | 1796 | +121*** | (+7%) | +306*** | (+17%) |
| international | 3272 | +179*** | (+5%) | +1215*** | (+37%) |
| type of allocation | |||||
| standard allocation | 14487 | +50 | (+0%) | -160* | (-1%) |
| non-standard | 2325 | -47 | (-2%) | +167* | (+7%) |
| ∗ p < 0.05, ∗∗ p < 0.01, ∗∗∗ p < 0.001 | |||||
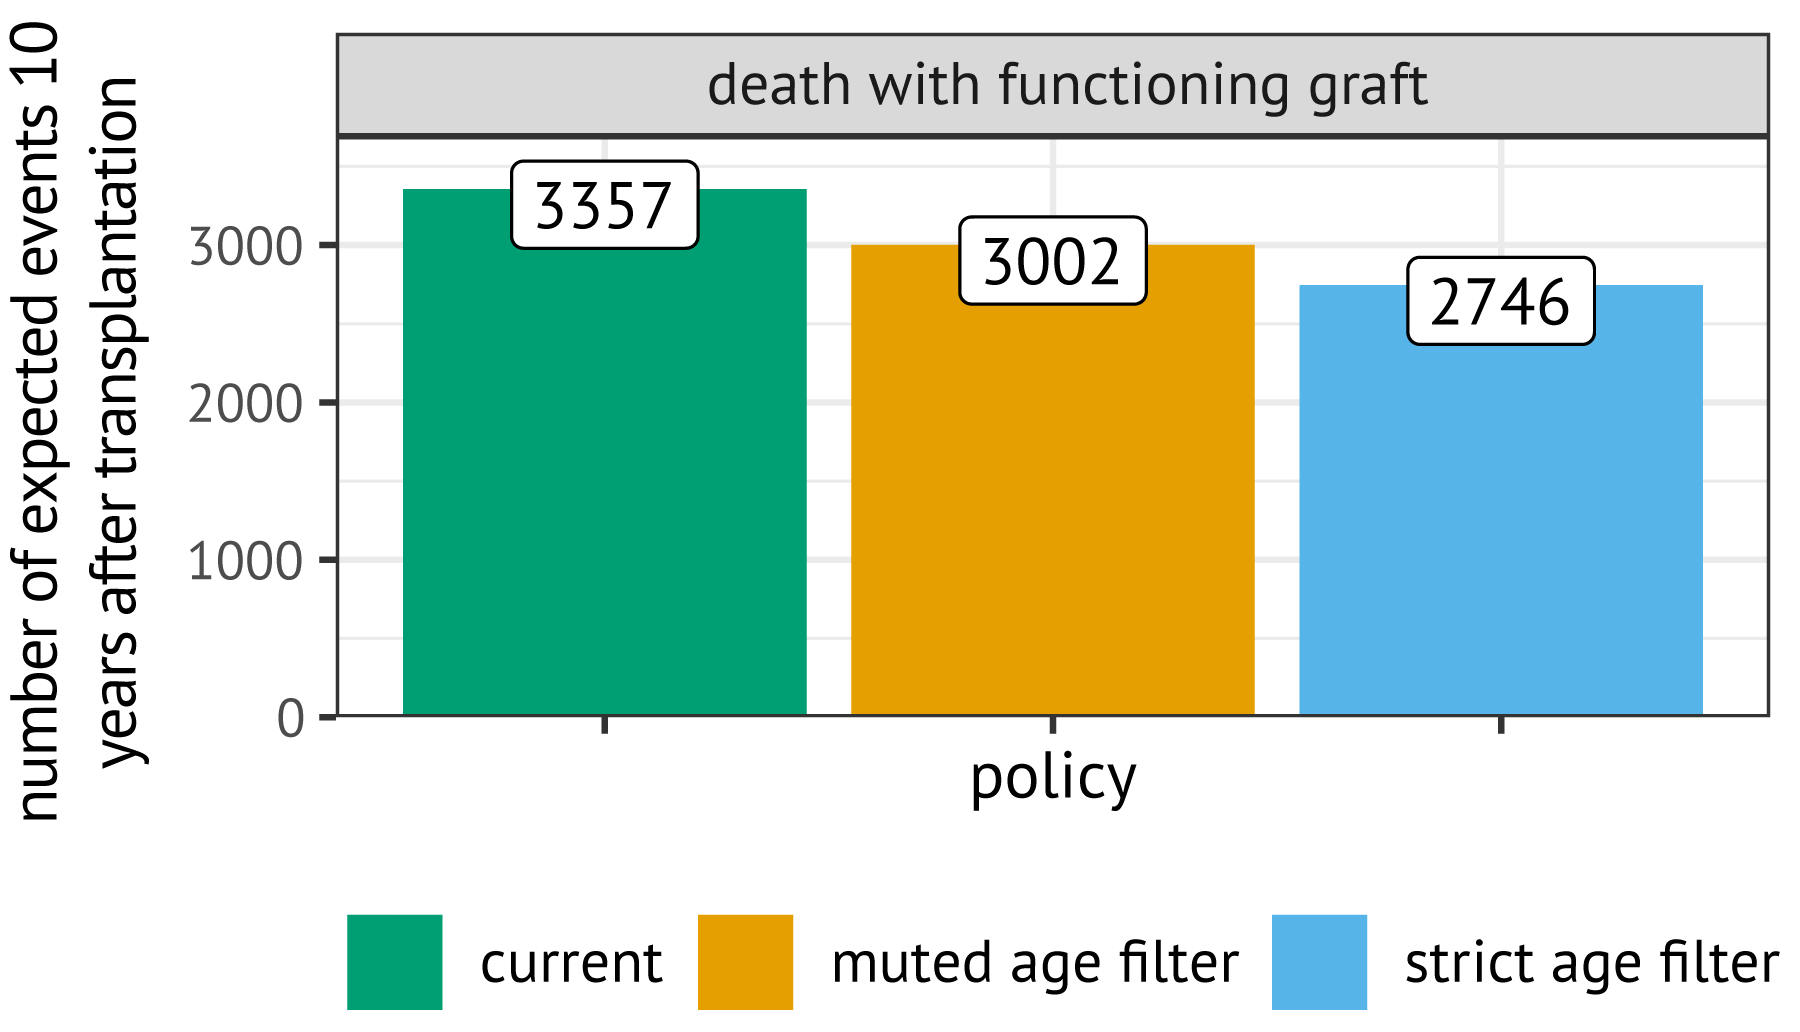
Figure 8.8: Expected number of post-transplant events ten years after transplantation, predicted based on candidate, donor, and transplantation characteristics with competing risk models.
8.7 Discussion and conclusion
Eurotransplant has long recognized the important role computer simulations could have for allocation development. For example, in the one-year evaluation of ETKAS that was published in 1998, the organization stressed that “introduction of a change must be preceded by a computer simulation study” [15]. However, Eurotransplant has only recently started the development of tools required for such simulation studies, with initiatives including the development of the ELAS simulator (see Chapter 5) and the passing a recommendation by the Thoracic Committee to develop a simulation tool for heart and lung allocation in 2024. Within this line of research, we present the ETKidney simulator.
Discrete-event simulators are already routinely used to update allocation rules in other geographic regions [85], [164], [165]. The most prominent simulator for kidney allocation is the Kidney-Pancreas Simulated Allocation Model (KPSAM), which was developed to simulate kidney allocation in the United States and which is made publicly available for research by the SRTR. KPSAM differs from the ETKidney simulator in several aspects. Firstly, KPSAM users have to manually specify in simulation inputs when a candidate would list for a repeat transplantation, as well as how their statuses would evolve after their return to the waiting list; in the ETKidney simulator, simulation of re-listings is instead based on historical data. Secondly, in KPSAM the graft offer acceptance behavior is simulated according to a single, patient-level logistic regression, while the ETKidney simulator additionally includes logistic regressions at the center level to capture that centers regularly decline kidneys for all their candidates. Thirdly, in KPSAM the kidneys that become available for allocation are discarded after a fixed number of offers, while the ETKidney simulator has functionality to simulate based on donor characteristics after how many offers Eurotransplant would stop offering the kidney in standard allocation. Thereafter, the ETKidney simulator switches to non-standard allocation. Such out-of-sequence offering is not simulated in KPSAM.
More important than these technical differences is that the ETKidney simulator is a bespoke model for Eurotransplant, which implements Eurotransplant-specific allocation mechanisms such as the points for the mismatch probability and the balance system that Eurotransplant uses to balance the international transfer of kidneys. Eurotransplant needs such a bespoke model in its communication with national competent authorities, who are interested not only in the overall effects of policies but also in the specific impacts that the policy changes have on their national waiting list populations. To build trust in the simulator, we have used input-output validation to show that the simulator can closely approximate contemporary transplantation patterns of ETKAS and ESP. Results of this validation exercise were discussed with medical doctors from Eurotransplant, and presented at the Eurotransplant Annual Meeting to additional major stakeholders, including representatives from national competent authorities as well as medical professionals from the kidney transplant centers. In the view of many of these stakeholders, the simulator has become a useful tool for kidney allocation policy development as we have also demonstrated in this chapter through three clinically motivated case studies.
From discussions with ETKAC, ETRL and other stakeholders, it became clear that the policies proposed in these case studies have to be refined further. The first case study focused on HLA matching at the A, B, and DR loci. This focus was motivated by the fact that HLA-B and HLA-DR are most strongly associated with graft loss in Eurotransplant. However, HLA matching in kidney transplantation also aims to prevent de novo sensitization. Recent literature has shown that HLA-DQ mismatches are most strongly associated with antibody formation [175], [184]. Further simulations should explore how HLA-DQ matching can be included in ETKAS.
The aim of the second case study was to develop a sliding scale that provides candidates with vPRAs below 85% with equality of opportunity in ETKAS. This aim was based on the fact that candidates with a vPRA >85% may have access to the AM program. However, it has been observed that certain patient groups in the AM program are transplanted within months of entering the program [138], which suggests that these candidates may not require priority that is given by the AM program. Based on these findings, ETRL and Eurotransplant’s advisory committees have recommended changing the AM entry criterion to a donor frequency of 2%, which corresponds to a vPRA of approximately 95%. The sliding scale proposed in this case study should be revised to ensure that candidates with vPRAs between 85% and 95% are not disadvantaged in ETKAS.
The final case study suggested that continuous candidate-donor age matching is a promising avenue to improve kidney allocation in Eurotransplant, because it substantially reduces the number of post-transplant deaths with a functioning graft. However, these reductions are partly due to a decrease in transplantations among candidates aged 55 and older. A question that should be explored further is whether these candidates should be given access to donors aged 65 and over, as was already unanimously recommended in a 2018 European Consensus Meeting [159]. Such access could be achieved by allowing candidates between 55 and 65 to participate in ESP, or by allocating donors aged over 65 via ETKAS. The preferred route should be discussed together with the advisory committees and national competent authorities. We acknowledge that the ETKidney simulator also has limitations. Firstly, the graft offer acceptance models and post-transplant survival models are calibrated to historical data. These models may lack external validity for future post-transplant survival and future offer acceptance behavior. An example of this, encountered during input-output validation, is that the simulator appears to underestimate the number of transplantations in immunized candidates after the introduction of the virtual crossmatch in Eurotransplant in January 2023. This limitation could be addressed by refitting the organ acceptance models in the future on more contemporary data. A second limitation is that validation was only based on historical input-output validation. Ideally, we would have been able to observe ETKAS and ESP outcomes under alternative allocation rules, and study whether the simulator would be able to capture simulated outcomes under these alternative rules [185]. Unfortunately, this was not feasible, since ETKAS and ESP allocation rules have undergone only minimal changes since their introductions in 1996 and 1999, respectively. A final limitation is that Eurotransplant is not allowed to publicly release information that could potentially identify its donors and candidates, which prevents exact reproduction of our simulations by external parties. We have tried to address this limitation by making synthetic data available on which kidney allocation can be simulated.
In conclusion, we are confident that the ETKidney simulator is a valuable tool for quantifying the impact of kidney allocation policy changes in Eurotransplant, as we demonstrated with three clinical case studies. We anticipate that the simulator can play a pivotal role in modernizing ETKAS and ESP allocation rules, in collaboration with subject-matter experts from ETKAC, the ETRL, and national competent authorities.
References
https://github.com/hansdeferrante/Eurotransplant_ETKidney_simulator↩︎
In case a multi-organ donor is reported to Eurotransplant, the donor’s kidneys may first be accepted by candidates waiting for a combined transplantation of a kidney with another organ (heart, lung, pancreas, liver, or intestine). These combined transplantations account for 7% of all deceased-donor kidney transplants in Eurotransplant [166].↩︎
The number of balance points awarded is calculated by subtracting from each member country’s export balance the export balance of the country which is the largest importer (a negative number), and multiplying the outcome by the balance weight. This balance weight is currently 30.↩︎
Before March 2021, kidneys which could not be successfully allocated via ESP were offered via ETKAS. After March 2021, such kidneys are allocated via non-standard ESP allocation.↩︎
Transplant recipients who require dialysis within one year of their initial kidney transplant may receive a portion of their previous waiting time back, see the Eurotransplant kidney manual [169].↩︎